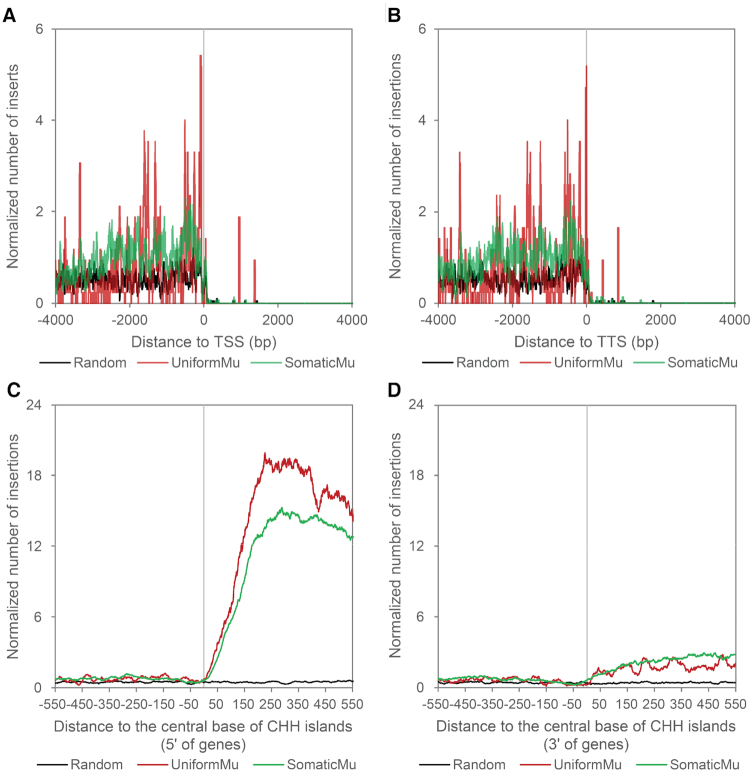
Figure 2.
Distribution of de novo Mu insertions near target sites of RNA Polymerases I, III, IV and V. (A and B) Metaprofiles of UniformMu and SomaticMu insertions surrounding TSS (A) and TTS (B) of tRNA and rRNA genes. The figure shows normalized numbers of insertions around TSSs and TTSs of annotated tRNA and rRNA genes. The insertion numbers at each distance were smoothed by computing the means in 30-bp rolling windows. Normalized numbers of genic insertions were plotted on the positive X-axis coordinates and those of intergenic insertions were plotted on the negative coordinates. (C and D) Distribution of UniformMu and SomaticMu insertions near CHH islands in maize located at 5′ (C) and 3′ ends (D) of maize genes. The 100-bp CHH islands are centered on position zero and range from −50 to 49 bp on the X-axis. Directions of CHH islands were unified so that nearby genes are located on the right of both 5′ and 3′ CHH islands.

