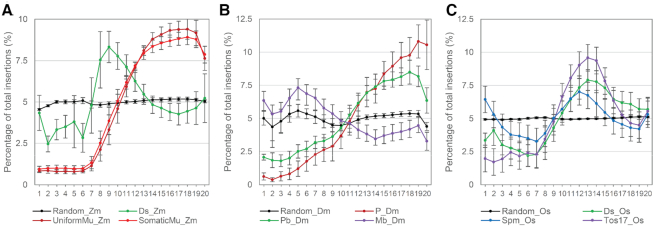
Figure 3.
De novo transposon insertions near genes expressed at different levels. Percentage of transposon insertions distributed in each of the 20 expression bins were shown for maize (A), Drosophila (B) and rice (C) transposons. The figures show the correlation between TE targeting frequency with categorized gene expression levels. For each RNA-seq dataset, the whole annotated gene set was grouped to 20 expression bins from low to high independently, each containing an equal number of genes. Allocation of genes in each bin was independently performed for each RNA-seq experiment. Each RNA-seq dataset was regarded as one replicate and the averaged percentages in each categorized expression levels were calculated. Error bars represent standard deviations of the percentages in each bin based on independent RNAseq datasets.

