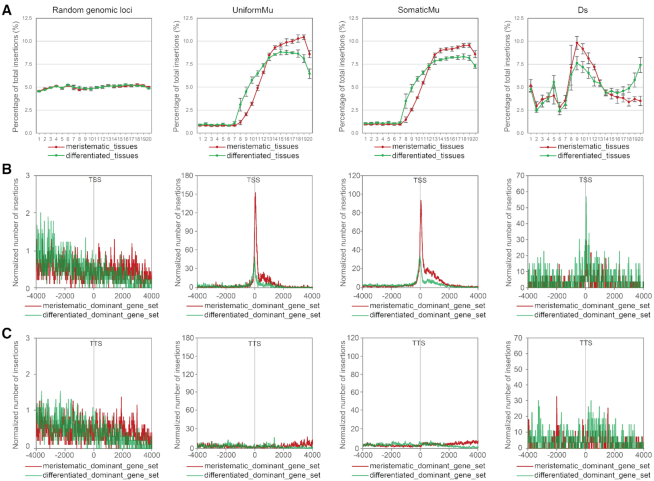
Figure 4.
Comparative analysis of the distribution of Mu and Ds elements in meristematic or differentiated tissues. (A) Percentage of random genomic loci, UniformMu, SomaticMu and Ds element insertions distributed in each of 20 expression bins in meristematic and differentiated tissues. An identical set of randomly selected loci that was used in Figure 1A (and 1D) was used as a background control. Error bars represent standard deviations of the percentages in each bin based on independent RNAseq datasets. (B and C) Metaprofiles of random genomic loci, UniformMu, SomaticMu and Ds elements in maize surrounding TSSs (B) and TTSs (C) of meristematic-dominant and differentiated-dominant gene sets, respectively. For both TSS and TTS plots, normalized numbers of genic insertions were plotted on the positive X-axis coordinates and normalized numbers of intergenic insertions were plotted on the negative coordinates. The insertion numbers at each distance were smoothed by computing the means in 30-bp rolling windows. An identical set of randomly selected loci used in Figure 1A (and 1D) was used as a background control.

