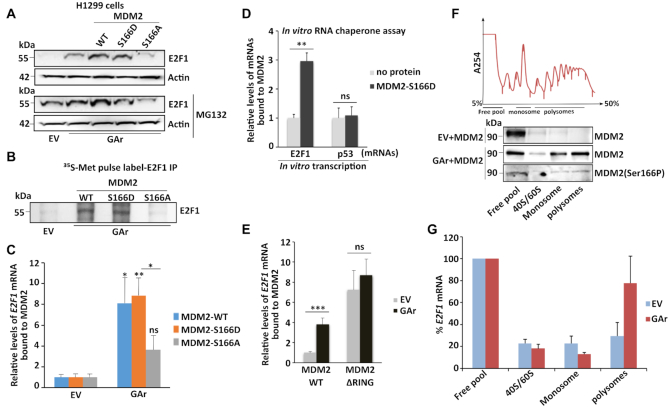
Figure 3.
MDM2 phosphorylation at serine 166 and the RING domain control MDM2 interaction with the E2F1 mRNA during translation stress. (A) WB showing E2F1 levels in H1299 cells expressing MDM2-WT, MDM2-S166D and the MDM2-S166A under normal and translation stress conditions in the presence (lower), or absence (upper) of the proteasome inhibitor MG132 (20 μM for 2 h). (B) Autoradiograph of 35S-Met metabolic pulse labeling in the presence of MG132 (20 μM) followed by E2F1 immunoprecipitation shows the rate of newly synthesized E2F1 proteins in the presence of indicated MDM2 constructs in H1299 cells. (C) H1299 cells expressing the MDM2-WT, MDM2-166D or the MDM2-166A constructs. Total RNA was isolated from cells under normal or translation stress (GAr) conditions and the graph shows the relative amount of E2F1 mRNA bound to recombinant MDM2-WT, MDM2-S166D and MDM2-S166A proteins, respectively. (D) Graph shows the binding of recombinant MDM2 protein to E2F1 and p53 mRNAs transcribed in vitro in the presence, or absence, of MDM2-S166D protein. Following RNA synthesis, the mRNAs were isolated and proteins removed and the relative amount bound to recombinant MDM2 protein was estimated. (E) The relative levels of E2F1 mRNA bound to recombinant MDM2-WT and to an MDM2 lacking the C-terminal RING domain (MDM2-ΔRING). Total RNA was isolated from H1299 cells lysates under indicated conditions. (F) Polysome profiling followed by WB analysis of pooled fractions under normal and translation stress conditions using MDM2 (4B2) and phospho-MDM2 (Ser166P) antibodies. (G) RT-qPCR analysis of E2F1 mRNA from corresponding fractions (F), enrichment of E2F1 mRNA in normal (EV) and translation stress conditions were plotted (see also Supplementary Figure S4D). Values were normalized with actin levels and are representative of three independent experiments. Statistical significance was calculated using t tests (***P < 0.001, **P < 0.01 and *P < 0.05).

