Figure 2.
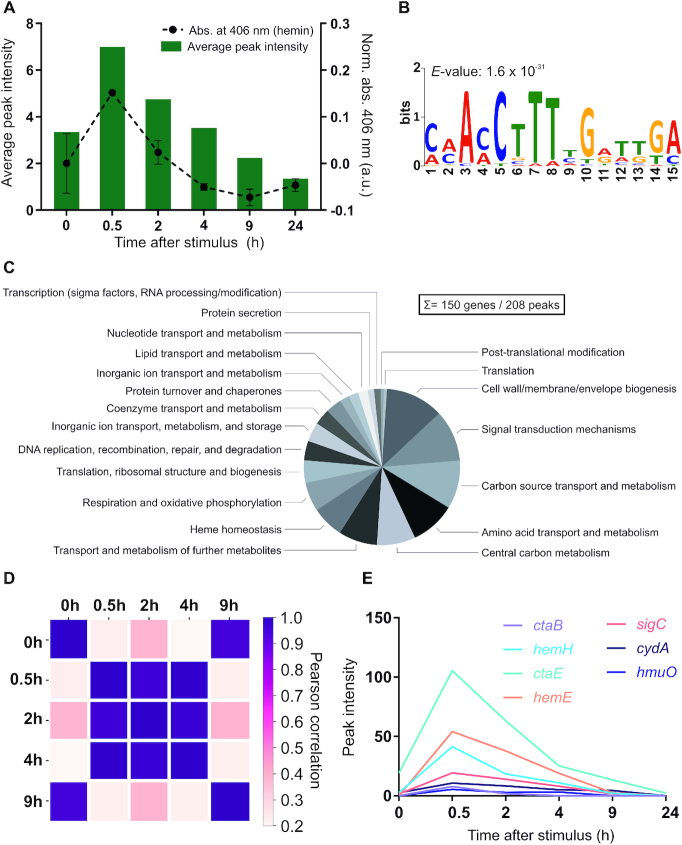
ChAP-Seq analysis revealed HrrA as a global regulator of heme homeostasis in Corynebacterium glutamicum. (A) HrrA binding in response to the addition of hemin. The bar plot reflects the average peak intensities among detected peaks in ChAP-Seq experiments (<800 bp to the next TSS). The binding was correlated with the amount of cell-associated hemin (dashed line), measured at corresponding time points by spectroscopy as described in ‘Materials and Methods’ section. (B) A binding motif was deduced from the sequences of the top 25 peaks (T0.5) using MEME v.5 analysis (http://meme-suite.org). (C) Pie chart presenting HrrA targets, which can be attributed to known functional categories (total of 272 genes, among which 128 encode proteins of unknown function, e.g. target genes within the CGP3 prophage region were excluded). For a complete overview of HrrA targets, see Supplementary Table S3. (D) Proportional behavior of the HrrA regulon. For each peak that passed the threshold (distance of <800 bp to the closest downstream or <200 to the closest upstream TSS) at time point A, the highest peak in the same region (±50 nt from the center of the peak) was selected for time point B and vice versa. Thus, ‘paired’ peaks for these two time points were obtained, and the Pearson correlation of the intensities of all paired peaks was calculated for all six time points. (E) Peak intensities of selected HrrA targets over time, as identified by ChAP-Seq.

