Figure 7.
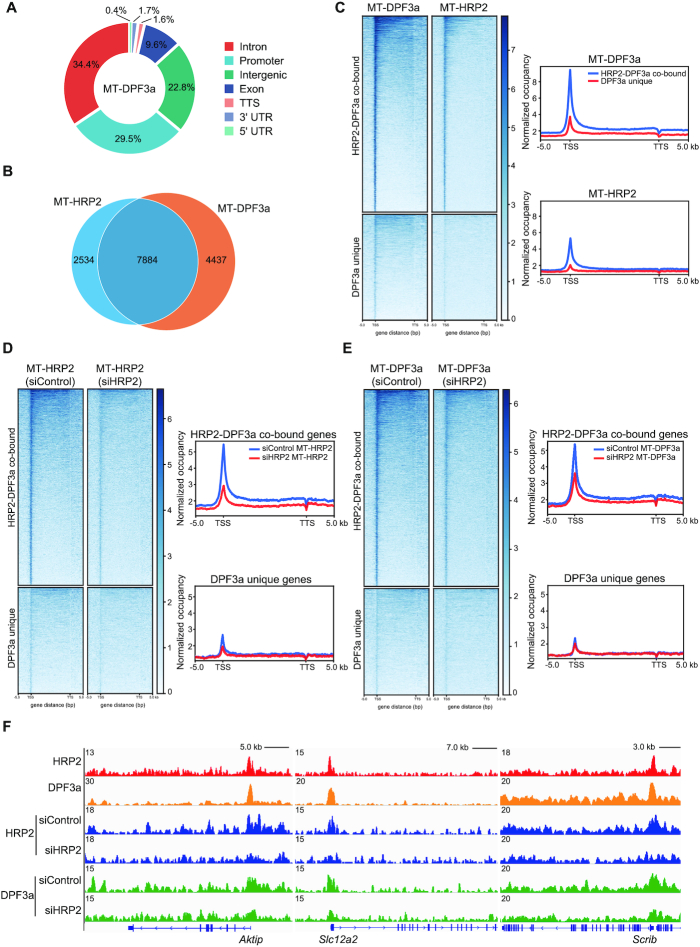
Genome-wide colocalization of DPF3a and HRP2 in myotubes. (A) Genome-wide distribution of DPF3a binding in C2C12 myotubes. (B) Venn diagram showing the number of overlaps between genes bound by HRP2 and DPF3a in C2C12 myotubes. (C) Heatmaps showing the distribution of DPF3a and HRP2 on HRP2-DPF3a-co-bound genes and DPF3a-unique genes for the region -5 kb from the TSS to +5 kb from the TTS. Genes on the heatmaps are ordered according to decreasing total level of DPF3a (left). Average genome-wide DPF3a and HRP2 occupancies are shown for HRP2-DPF3a-co-bound genes and DPF3a-unique genes. Sequences 5 kb upstream of the TSS and 5 kb downstream of the TTS are also included (right). (D) Heatmaps showing the distribution of HRP2 on HRP2-DPF3a-co-bound genes and DPF3a-unique genes in WT and HRP2 knockdown cells for the region from -5 kb to +5 kb from the TTS. Genes on the heatmaps are ordered according to decreasing total level of HRP2 (left). Average genome-wide HRP2 occupancies are shown for HRP2-DPF3a-co-bound genes and DPF3a-unique genes in WT and HRP2 knockdown cells. Sequences 5 kb upstream of the TSS and 5 kb downstream of the TTS are also included (right). (E) Heatmaps showing the distribution of DPF3a on HRP2-DPF3a-co-bound genes and DPF3a-unique genes in WT and HRP2 knockdown cells for the region −5 kb from the TSS to +5 kb from the TTS. Genes on the heatmaps are ordered according to decreasing total level of DPF3a (left). Average genome-wide DPF3a occupancies are shown for HRP2-DPF3a-co-bound genes and DPF3a-unique genes in WT and HRP2 knockdown cells. Sequences 5 kb upstream of the TSS and 5 kb downstream of the TTS are also included (right). (F) Gene tracks showing representative ChIP-Seq profiles for the indicated proteins in various cells as indicated at the Aktip, Slc12a2 and Scrib gene loci.

