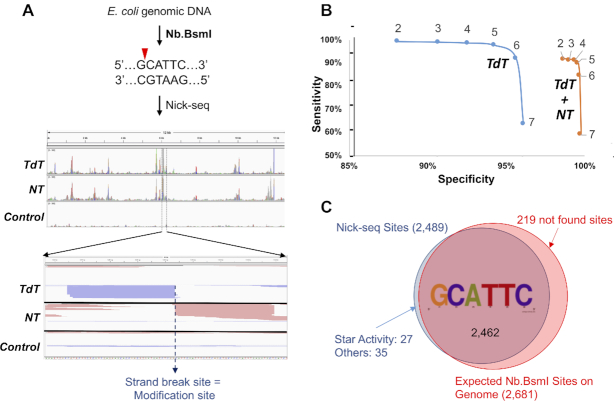
Figure 2.
Nick-seq validation. (A) Mapping single-strand breaks produced by Nb.BsmI in E. coli genomic DNA. Middle panel: Representative view of sequencing reads distributed in one genomic region. Red and green peaks mark reads mapped to forward and reverse strands of the genome, respectively. Lower panel: Amplification of the genomic region surrounding one peak, with read pile ups for TdT and NT sequencing converging on the site of the strand-break. (B) Nb.BsmI mapping data were used to define data processing parameters for accuracy and sensitivity of Nick-seq. Coverage ratios (the ratio of the peaks relative to corresponding sites in an untreated DNA control) were calculated for sequencing data performed with TdT alone (blue line) or the combination of TdT and NT (orange line). The sensitivity and specificity for detection of site-specific strand-breaks was then plotted for ratios ranging from 2 to 7. In general, higher coverage ratios yield greater accuracy but lower sensitivity, and the combination of TdT and NT provided significantly greater specificity. (C) With a coverage ratio of 2, Nick-seq identified 2462 (97.5%) of the 2681 predicted Nb.BsmI sites. Among the 62 (2.5%) ‘false-positive’ sites, 27 (1%) of them occurred in sequences differing from the consensus by one nucleotide. These sites showed lower average sequencing coverage (75 versus 1318) and likely represent Nb.BsmI ‘star’ activity.

