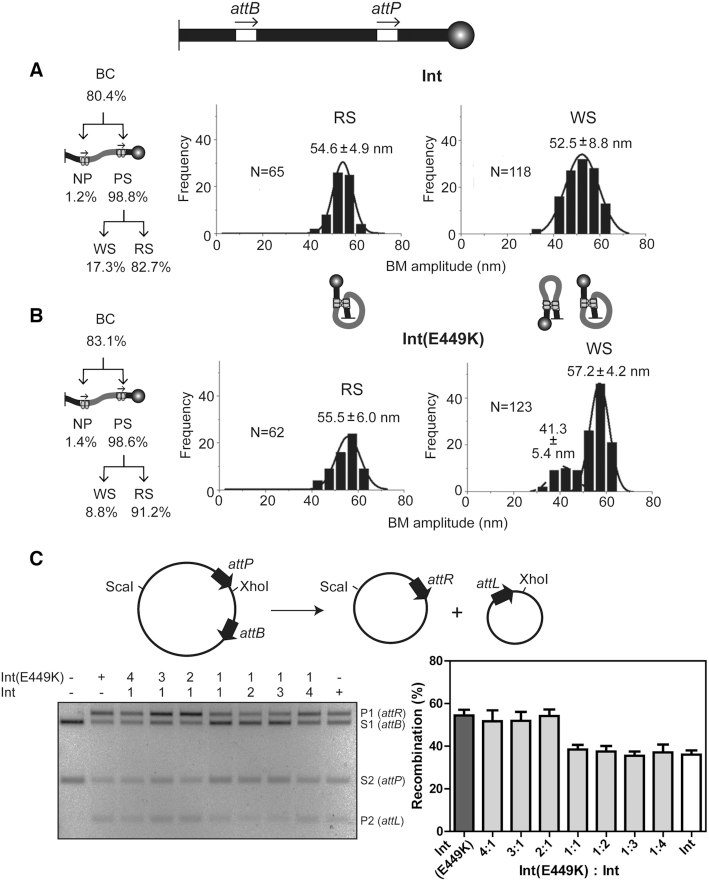
Figure 3.
Int and Int(E449K) mediated attP × attB recombination. (A and B) The DNA substrate containing attB and attP sites in head-to-tail orientation is schematically drawn at the top with the tethering surface and the polystyrene bead indicated as in Figure 2. The partitioning of the total BC into individual complexes is indicated at the left. The plots of the BM amplitude distributions of the functional (RS) and non-functional (WS) synaptic complexes are based on the data from Supplementary Figure S2A. N refers to the number of these two synaptic states (or the number of transition events generating them) captured in single molecule time traces. For example, the trace III shown in Figure 2 would have contributed N = 2 toward WS events. N is larger for the WS plot as one molecule can potentially form an abortive synapse in a recurrent fashion. An RS synapse by definition is a unique event for a molecule, resulting in completion of recombination. In this figure (and in Figures 4–6), the schematics of synapsed molecules are meant to indicate that the arrangement of the att sites in the WS complexes may be heterogeneous, parallel (lower BM amplitude species) or anti-parallel (higher amplitude species). In the RS complex, the arrangement is parallel. (C) The circular substrate used in the ensemble assays and the products of recombination are shown schematically at the top. Reactions contained Int or Int(E449K), or the indicated molar ratios of the two. Recombination was assayed by ScaI plus XhoI digestion of DNA, and agarose gel electrophoresis. The bands resulting from the substrate are labeled S1 (attB), S2 (attP); those resulting from the products are labeled P1 (attR), P2 (attL). The mean recombination efficiencies (±SD) from three separate assays are plotted.

