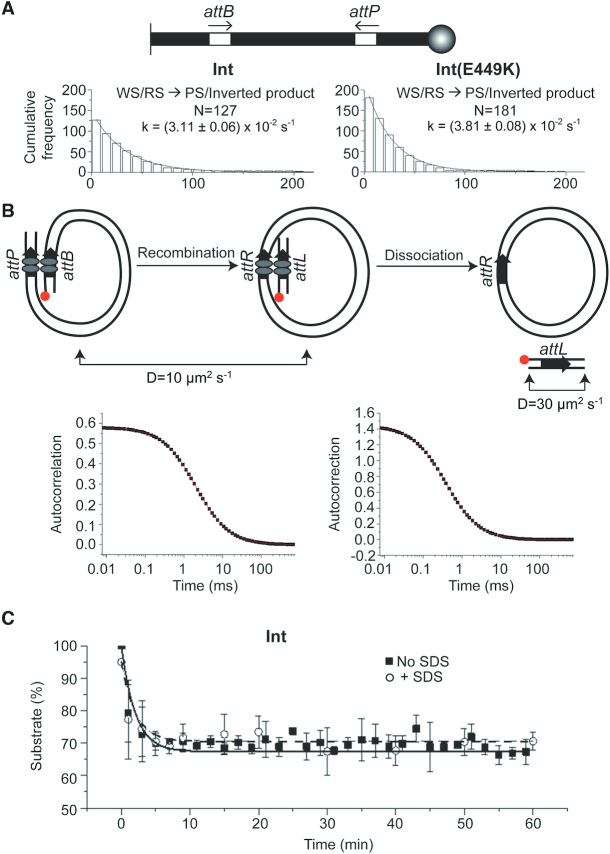
Figure 7.
Recombination kinetics analyzed by TPM and FCS. (A) The substrate for the TPM analysis contained attP-attB in head-to-head orientation. The histogram plots depict the dwell times of BC in the low BM amplitude synapsed state (WS/RS; as recorded by the single molecule time traces). Their dissociation kinetics followed a single exponential model. N = the set of all synapsed molecules. (B) In the substrate containing head-to-tail attP-attB sites used for the FCS assay, the position of the TMR-fluorophore is indicated. The recombination reaction is schematically diagrammed to show the size difference between the fluorophore containing DNA species before (849 bp) and after (91 bp) the reaction. To determine the diffusion coefficient of the short linear product, a PCR amplified DNA of identical length with the fluorophore at the same location was used. The dissociation of the product synapse (with or without SDS addition) was assayed by the generation of the fast diffusing short fluorophore containing DNA. For a fast dissociating product synapse, the SDS effect will be minimal or absent. (C) The progress of recombination with and without SDS challenge is plotted as the decrease in the slow diffusing substrate with time.

