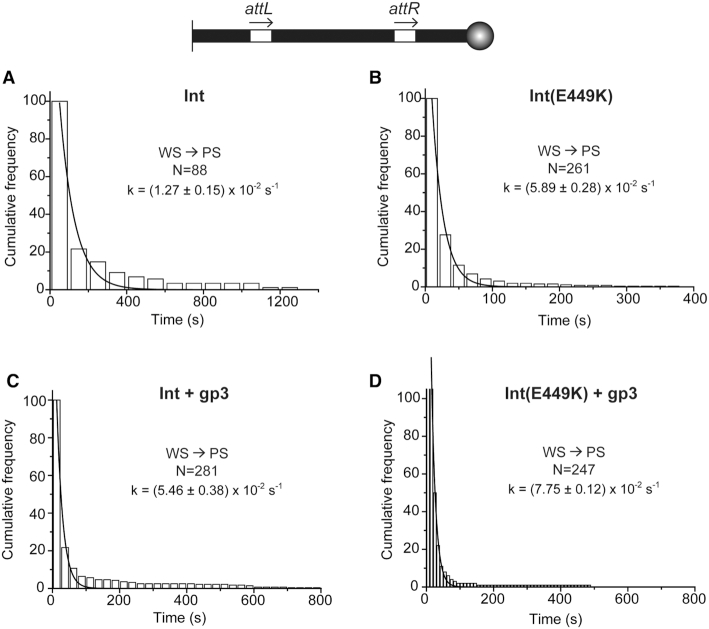
Figure 8.
Dissociation kinetics of abortive synaptic complexes assembled in the attL-attR (head-to-tail) DNA substrate. (A–D). The dwell times of the WS complexes before their dissociation to PS complexes were collected from single molecule time traces. For easy comparison between individual panels, the ordinate at time zero was normalized as ‘100’ in all plots. The rate constants for dissociation k-WSd was obtained by fitting the histogram plots to a single exponential algorithm. N = the total number of WS complexes observed.

