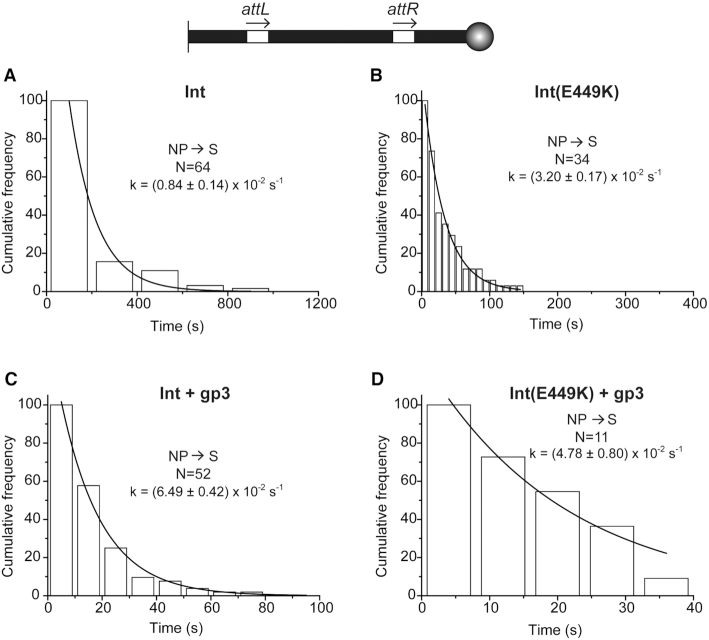
Figure 9.
Dissociation kinetics of NP assembled in the attL-attR (head-to-tail) DNA substrate. (A–D). The dwell times of the NP complexes before dissociating to S were determined from single molecule time traces, and were plotted as in Figure 8 with the ordinate at time zero normalized as ‘100’. A single exponential algorithm was employed to derive k-NPd. N = the total number of NP complexes observed.

