Figure 1.
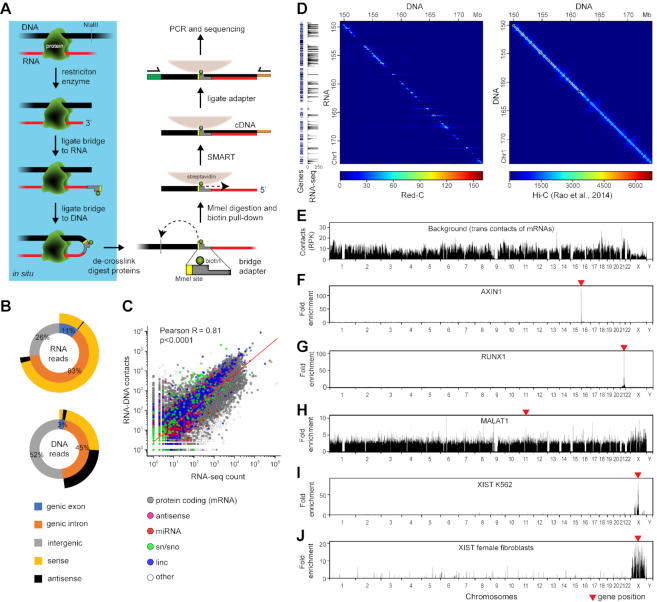
The Red-C technique. (A) Outline of Red-C protocol. (B) Genomic distribution of DNA and RNA reads extracted from forward and reverse sequencing reads, respectively. As genic, we used RefSeq protein-coding genes that occupy 37% of the genome. Reads having the same direction as the transcript are defined as sense; reads having the opposite direction to the transcript are defined as antisense. (C) Correlation of RNA–DNA contacts with RNA-seq signal in K562 cells. Red line, linear regression. (D) RNA–DNA (Red-C) and DNA–DNA (K562 Hi-C (33)) contact matrices for a region of Chr 1 at a 100 kb resolution. RNA-seq profile for K562 (1 kb bins) and gene distribution are shown alongside. (E) Background profile in K562 cells. RPK, reads per kb. (F–J) Fold enrichment of selected RNAs compared to the background in K562 cells (F–I) and female fibroblasts (J). MALAT profile is at 1 kb resolution; the other profiles are at 100 kb resolution.

