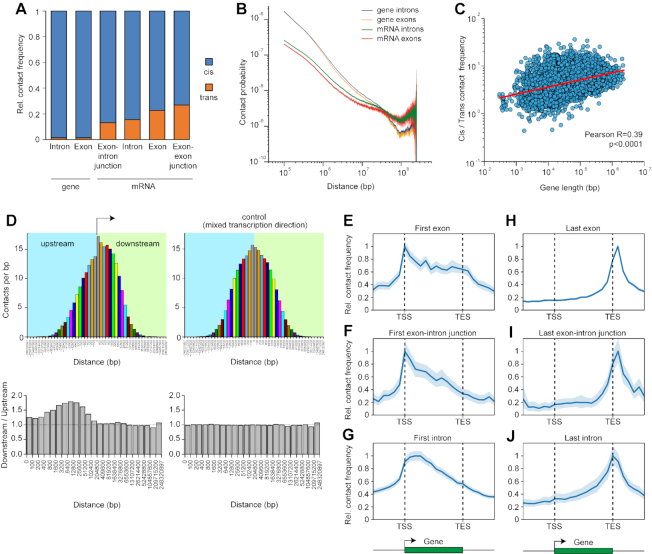
Figure 4.
Inter- and intra-chromosomal contacts of mRNAs. (A) Relative frequency of cis and trans contacts for different regions of mRNAs and protein-coding genes averaged for all chromosomes. See also Supplementary Figure S8. (B) Double logarithmic scaling plot of the dependence of contact probability on genomic distance for exons and introns of mRNAs and protein-coding genes. Colored area in the background of curves, 95% CI. (C) Correlation between length of protein-coding genes and ratio between frequencies of cis and trans contacts for mRNAs encoded by these genes. (D) Frequency of contacts of mRNA fragments with downstream and upstream intervals with (left) or without (right) respect to the direction of transcription. Pairs of bars of the same color represent results for equally spaced regions downstream and upstream of mRNA fragments. Shown below are the ratios of contact frequencies between equally spaced regions downstream and upstream of mRNA fragments. (E–J) Contacts of the different regions of mRNA with the body of the encoding gene and its flanking regions averaged over all mRNAs establishing at least one contact with the gene body or flanking areas (n = 11 122). The maximal value of the averaged profile is taken to be equal to 1. Colored area in the background of curves, 95% CI.

