
Figure 3.
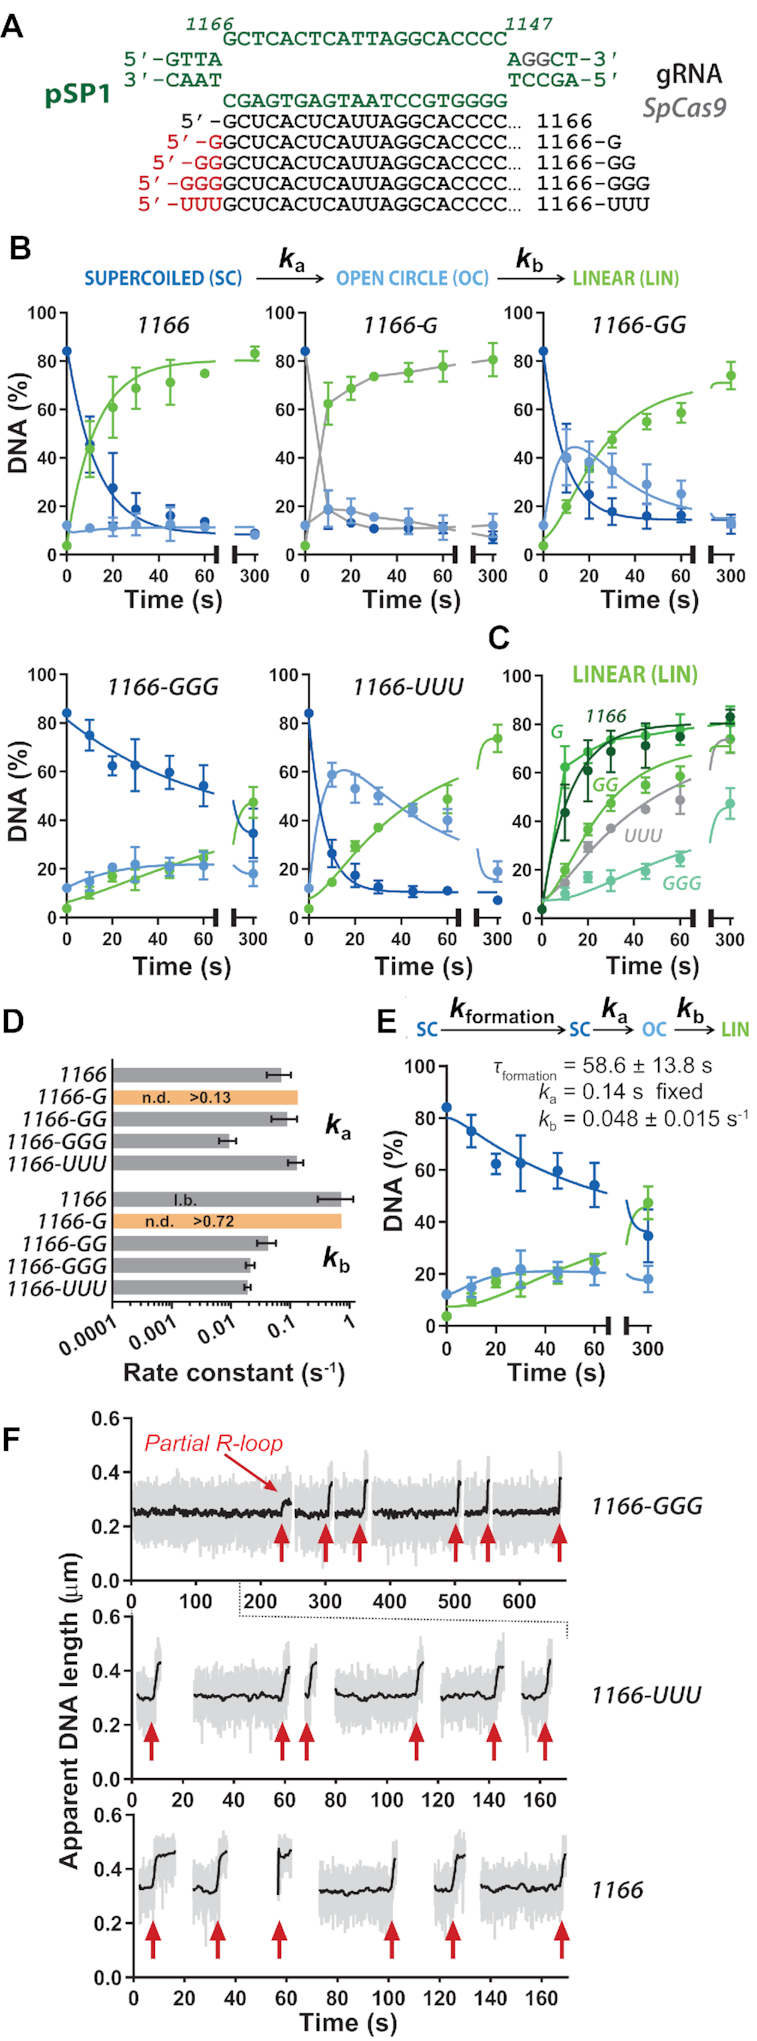
The effects of unpaired bases at the 5′ end of gRNA on Streptococcus pyogenes Cas9 at an alternative protospacer sequence. (A) Sequence of the 20 bp R-loop at the protospacer sequence at 1166–1147 bp of pSP1 (green). 5′ unpaired bases are shown in red for each of the gRNAs. (B) Quantified supercoiled plasmid cleavage assays from gels shown in Supplementary Figure S7A. Except for 1166-G for which a satisfactory fit was not possible, the kinetic model (Materials and Methods, Supplementary Figure S6) was simultaneously fitted by numerical integration to each repeat separately, and the kinetic constants averaged (Supplementary Table S4). Solid lines are simulations using the average values except for the 1166-G data where linear interpolations between the points (grey lines) are shown to guide the eye. x-axes are split as 0–65 s and 75–300 s. (C) Comparison of the appearance of LIN product and fitted profiles for each gRNA taken from panel B. x-axis split as 0–65 s and 75–300 s. (D) Average apparent rate constants for the first and second strand cleavage calculated from the fits in panel B (N = 3 ± SD) (Supplementary Table S4). (E) The alternative kinetic model that incorporates R-loop formation (Supplementary Figure S6) was simultaneously fitted by numerical integration to each repeat separately of the 1166-GGG data and the kinetic constants averaged (Supplementary Table S4). Solid lines are simulations using the average values. Ka was fixed at 0.14 s−1 based on the average value in panel D. x-axis split as 0–65 s and 75–300 s. (F) Example MT traces showing R-loop formation events (red arrows). Raw (grey) and 2 Hz smoothed data (black) are shown. Each trace represents measurements on the same single DNA.