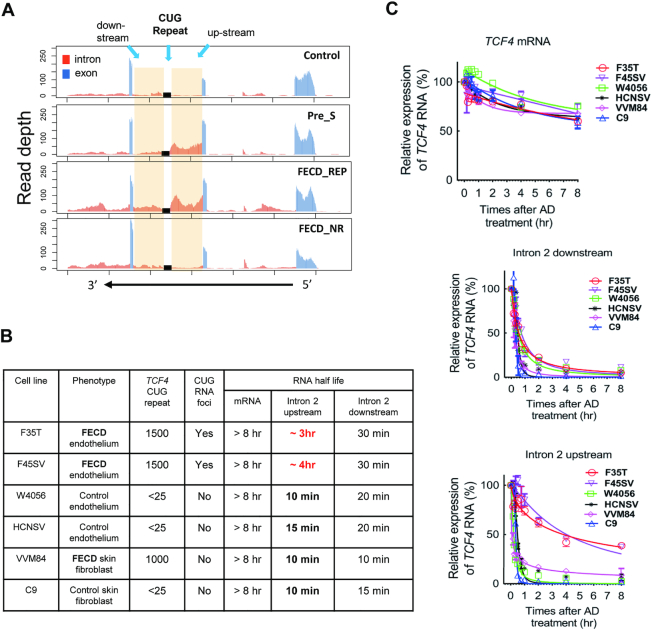
Figure 3.
Intronic RNA is stabilized in Pre_S and FECD_REP tissue and FECD_REP patient-derived F35T & F45SV corneal endothelial cells. (A) Representative RNAseq data showing relative read number for TCF4 intron 2 RNA from each sample cohort. (B) Summary of RNA half-life of different cell lines after treatment with actinomycin D. The much longer half life of intron 2 up-stream RNA in F35T & F45SV cells is highlighted in red. (C) Graphs of time-dependent RNA decay following treatment with actinomycin D.

