Figure 4.
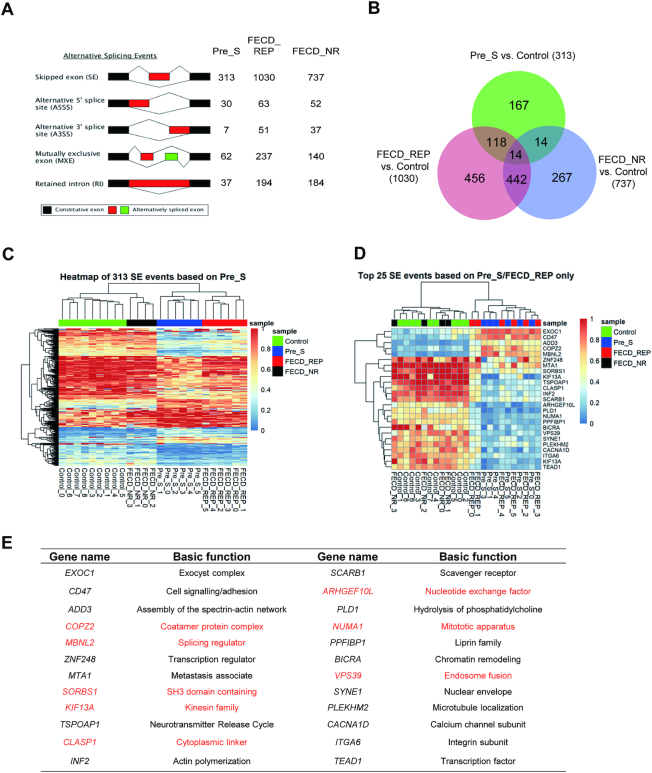
RNAseq data demonstrates changes in splicing in pre-symptomatic, FECD_REP and FECD_NR tissue. (A) Alternative splicing events in Pre_S, FECD_REP and FECD_NR cohorts. (B) Overlap between sample cohorts for skipped exon (SE) events showing that late stage disease FECD_REP and Pre_S cohorts cluster differently from control or FECD_NR cohorts. (C) Heat map comparing inclusion levels of exons among four cohorts. The chosen SE events were based on the 313 significant skipped exon events identified in Pre_S tissues. The Pre_S cohort is more similar to FECD_REP than it is to the other two cohorts. (D) The similarity of Pre_S and FECD_REP is emphasized by a heat map comparing top 25 SE events in common between FECD_REP and Pre_S tissues and corresponding changes in FECD_NR and control tissues. (E) Identity of top 24 SE events in common between FECD_REP and Pre_S. Genes in red are also observed in RNAseq data from DM1 tissue, demonstrating substantial overlap despite different tissue origins. The threshold used in identifying the significant events: FDR < 0.001, |IncLevel Difference| ≥0.15.

