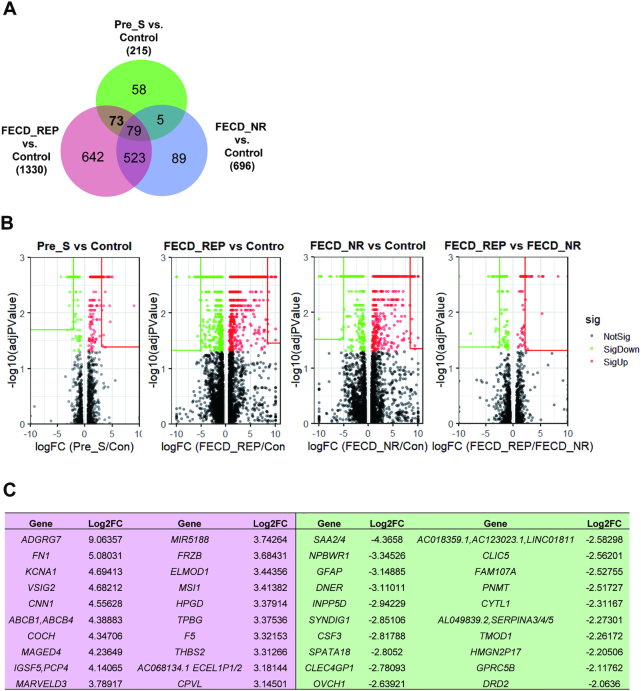
Figure 6.
RNAseq analysis of gene expression. (A) Overlap for gene expression of Pre-S, FECD_REP and FECD_NR cohorts. Numbers indicate the number of differentially expressed genes identified in each individual region. (B) Volcano plots for Pre_S versus Control, FECD_Rep versus Control, FECD_NR versus Control and FECD_REP versus FECD_NR and top genes in each comparison. (C) Top 20 upregulated and downregulated genes in Pre_S versus control comparison.

