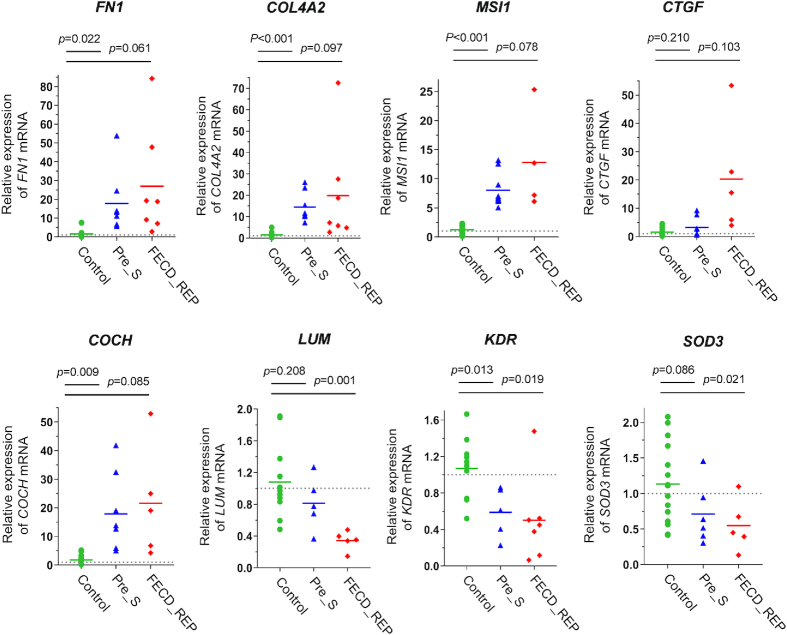
Figure 7.
Changes in gene expression in Pre_S and FECD_REP tissue. qPCR evaluation of gene expression levels in Control, Pre_S and FECD_REP tissue. All measurements used surgically prepared single cell monolayer corneal endothelium from disease patients or donors detailed in Supplementary Table S1.

