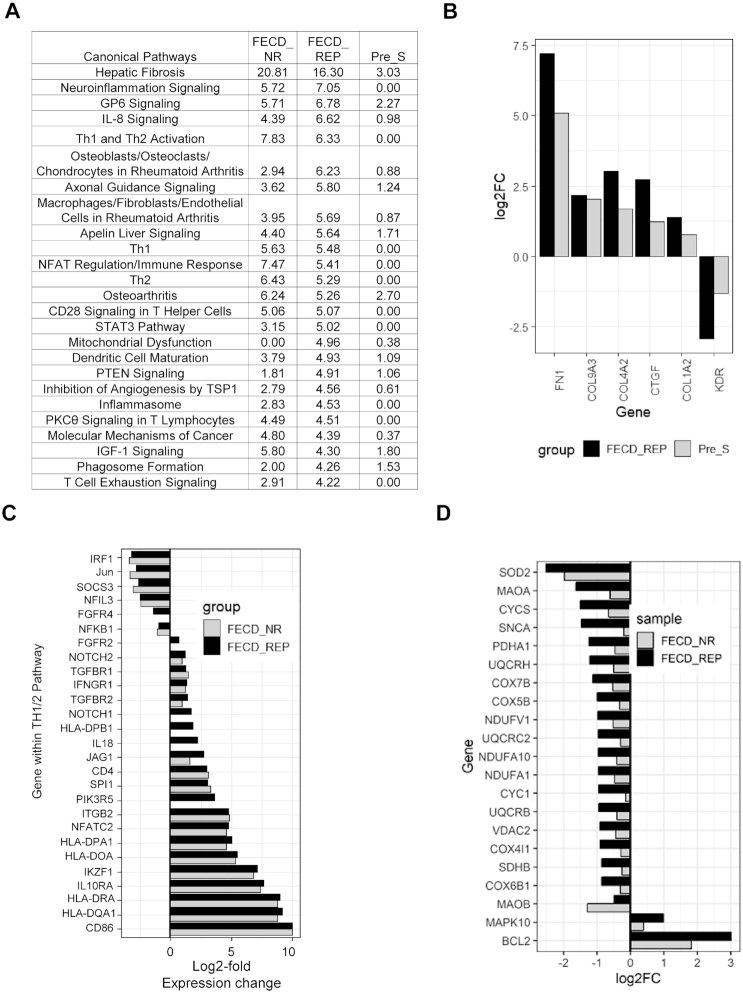
Figure 8.
Pathway analysis. (A) Top 25 pathways based on FECD_REP. The P-values for three cohorts for each pathway are shown in the last three columns. (B) Shared differentially expressed genes in Fibrosis pathway between Pre-S and FECD_REP. (C) Changes in Th1/2 pathway genes for FECD_NR and FECD_REP. (D) Significant expression level changes in genes involved in mitochondrial dysfunction seen in FECD_REP but not in FECD_NR. FPKM > 1.5, fold change > 1.5, FDR ≤ 0.05.

