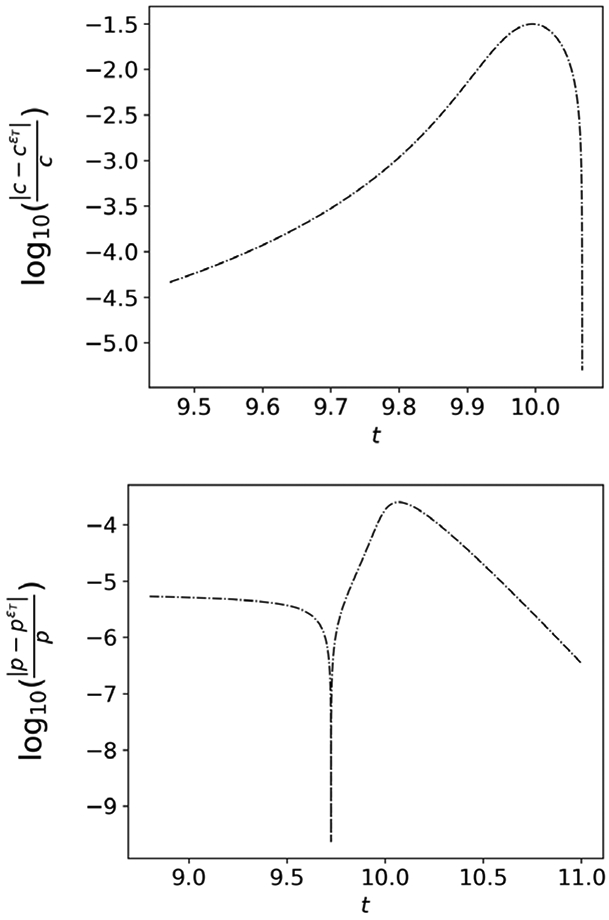
Figure 10: The tQSSA can worsen as t → ∞ if εL is not sufficiently small.

In both panels, the numerical solution is obtained with parameter values: e0 = 10, s0 = 1000, k1 = 20, k−1 = 10, k2 = 10. Thus, εT ~ 10−6, but εL ≈ 0.45. top panel: The log10 of the relative error between the numerical solution to the mass action equations (27a)-(27b) for c, and the numerical solution to the asymptotic approximation (29), denotes cεT, is demarcated by the dashed-dotted line. bottom Panel: The dashed-dotted line demarcates the log10 of the relative error between the numerical solution to the mass action equations (27a)-(27b) for p, and the numerical solution to the asymptotic approximation (30), denoted pεT. Even though timescale separation is quite large, there are regions in the numerically-obtained time course data where cεT approximates c only to within one digit of accuracy. While the loss in accuracy may not be outright disastrous in terms of parameter estimation, it is an observation that is worth pointing out in order to gain a deeper quantitative understanding of the various QSS approximations utilized for Michaelis–Menten reaction mechanism (1). The parameters have been assigned arbitrary units for illustrative purposes.
