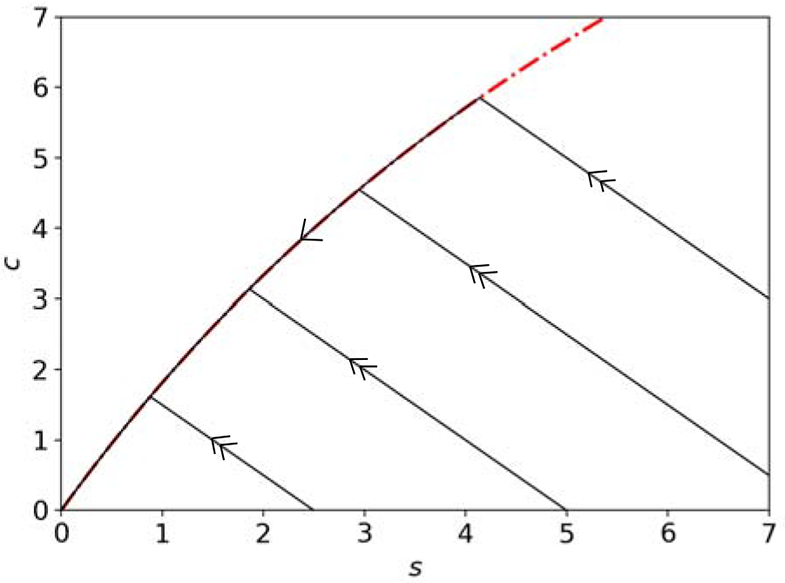
Figure 2: The extended QSSA: Fast/slow dynamics still occur when εSS ~ 1, but ν ≪ 1 for the MM reaction mechanism (1).

The solid black curves are the numerical solutions to the mass action equations (5a)-(5c), and the dashed/dotted red curve is the c-nullcline. In this simulation, k1 = k−1 = 10, k2 = 0.01 with κ ≡ k−1/k2 = 100, ν = 1/101, and εSS = 1 in arbitrary units for illustrative purposes. Note that the trajectory is not a vertical straight line during the initial phase of the reaction. As a consequence, the RSA does not hold [30, 39], and there is noticeable depletion of substrate during the transient phase. However, the trajectory still follows the c-nullcline after a brief transient and achieves the slow QSS dynamics. The double arrows indicate fast dynamics, and single arrows indicate slow dynamics.
