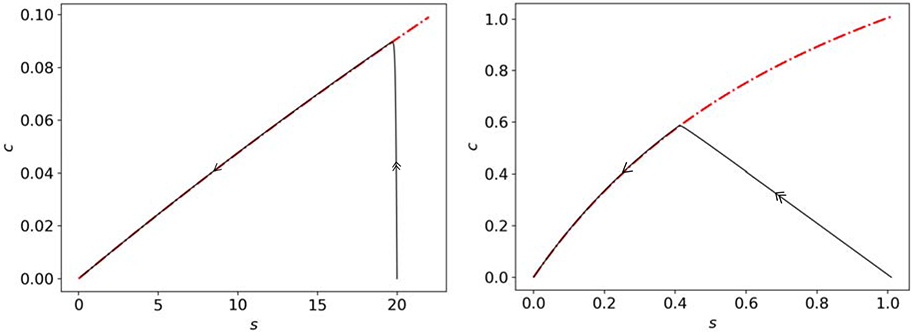
Figure 4: The extended QSSA equation (21) proposed by Segel and Slemrod [30] is invalid when ν ≪ 1 but εSS = σ = 1.

In both panels, the solid black curve is the numerical solutions to the mass action equations (5a)-(5c), and the dashed/dotted red curve is the c-nullcline. left: In this panel, s0 = 20, e0 = 1, k2 = k−1 = 10, k1 = 0.1, and the sQSSA is valid, and the trajectory moves almost vertically towards the c-nullcline, which is the hallmark of the sQSSA in the (s, c) phase-plane. right: This panel is illustrates the path of a trajectory when k2 ≪ k−1 but εSS = 1. The parameters utilized in the numerical simulation are: k1 = k−1 = 1, k2 = 0.01 with κ = 100 and σ = 1. Notice the trajectory is no longer vertical during the initial phase of the reaction as there is substantial loss of substrate during the fast transient. Once the trajectory reaches the c-nullcline, the approximation given by (51) is valid, and can be equipped with the initial condition if εSS = σ = 1. Although the sQSSA looks valid in both panels based on the proximity of the trajectory to the c-nullcline, GSPT indicates it is only valid in the left panel. In this figure, double arrows represent fast dynamics, and single arrows represent slow dynamics. All units are arbitrary.
