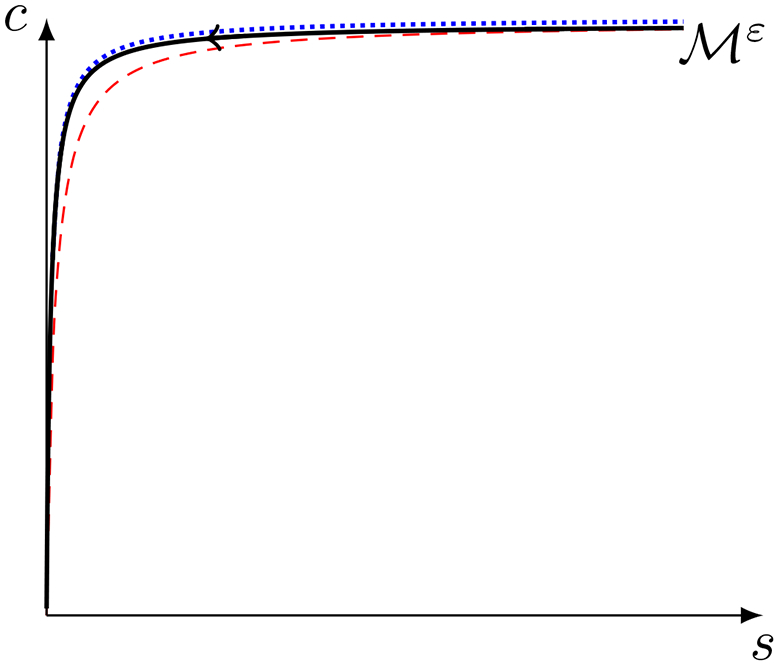
Figure 7: Near the origin, the slow manifold lies close to the s-nullcline in the (s, c) phase–plane when 1 ≪ η.

This figure is an illustration and is meant to convey conceptual features that occur in the phase–plane when η ≫ 1. The solid black curve is the slow manifold; the dotted blue curve is the s-nullcline, and the dashed red curve is the c-nullcline. When η is sufficiently large, the slow manifold lies very close to the s-nullcline at sufficiently small s. Comparing with figure 3, this is exactly the condition we need in order to apply the rQSSA
