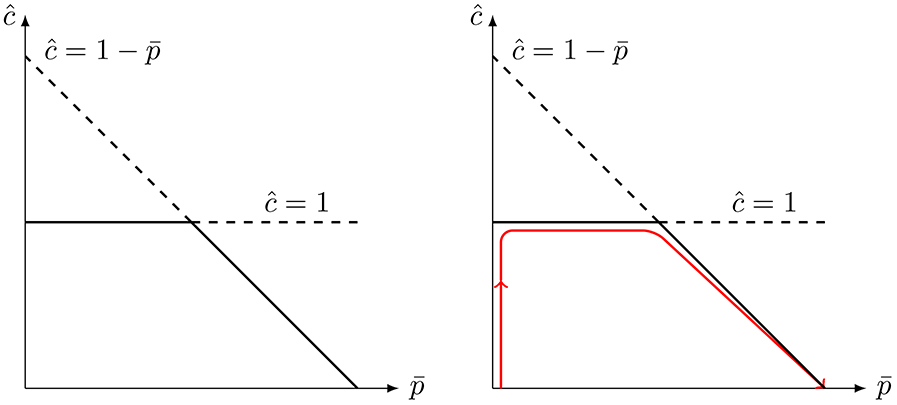
Figure 8: The critical set of the rQSSA when e0 < s0 and KM = 0.

This figure provides a visualization of the invariant set recovered by setting e0 < s0 and k−1 = k2 =0. Left: The critical set contains two transversely intersecting branches of fixed points. Thick solid curves correspond to non-isolated stable fixed points, and thick dashed lines correspond to unstable fixed points. The horizontal curve corresponds to the critical set , and the diagonal curve corresponds to the critical set . The trajectory rapidly approaches the curve , then reaches the curve once t ~ tℓ, and begins descending towards the origin. Clearly, each set constitutes a normally hyperbolic manifold everywhere except where the branches intersect, which corresponds to a transcritical singularity. Right: A typical trajectory (red solid curve) closely follows the attracting critical submanifolds once the perturbation is turned on.
