
Fig. 4.
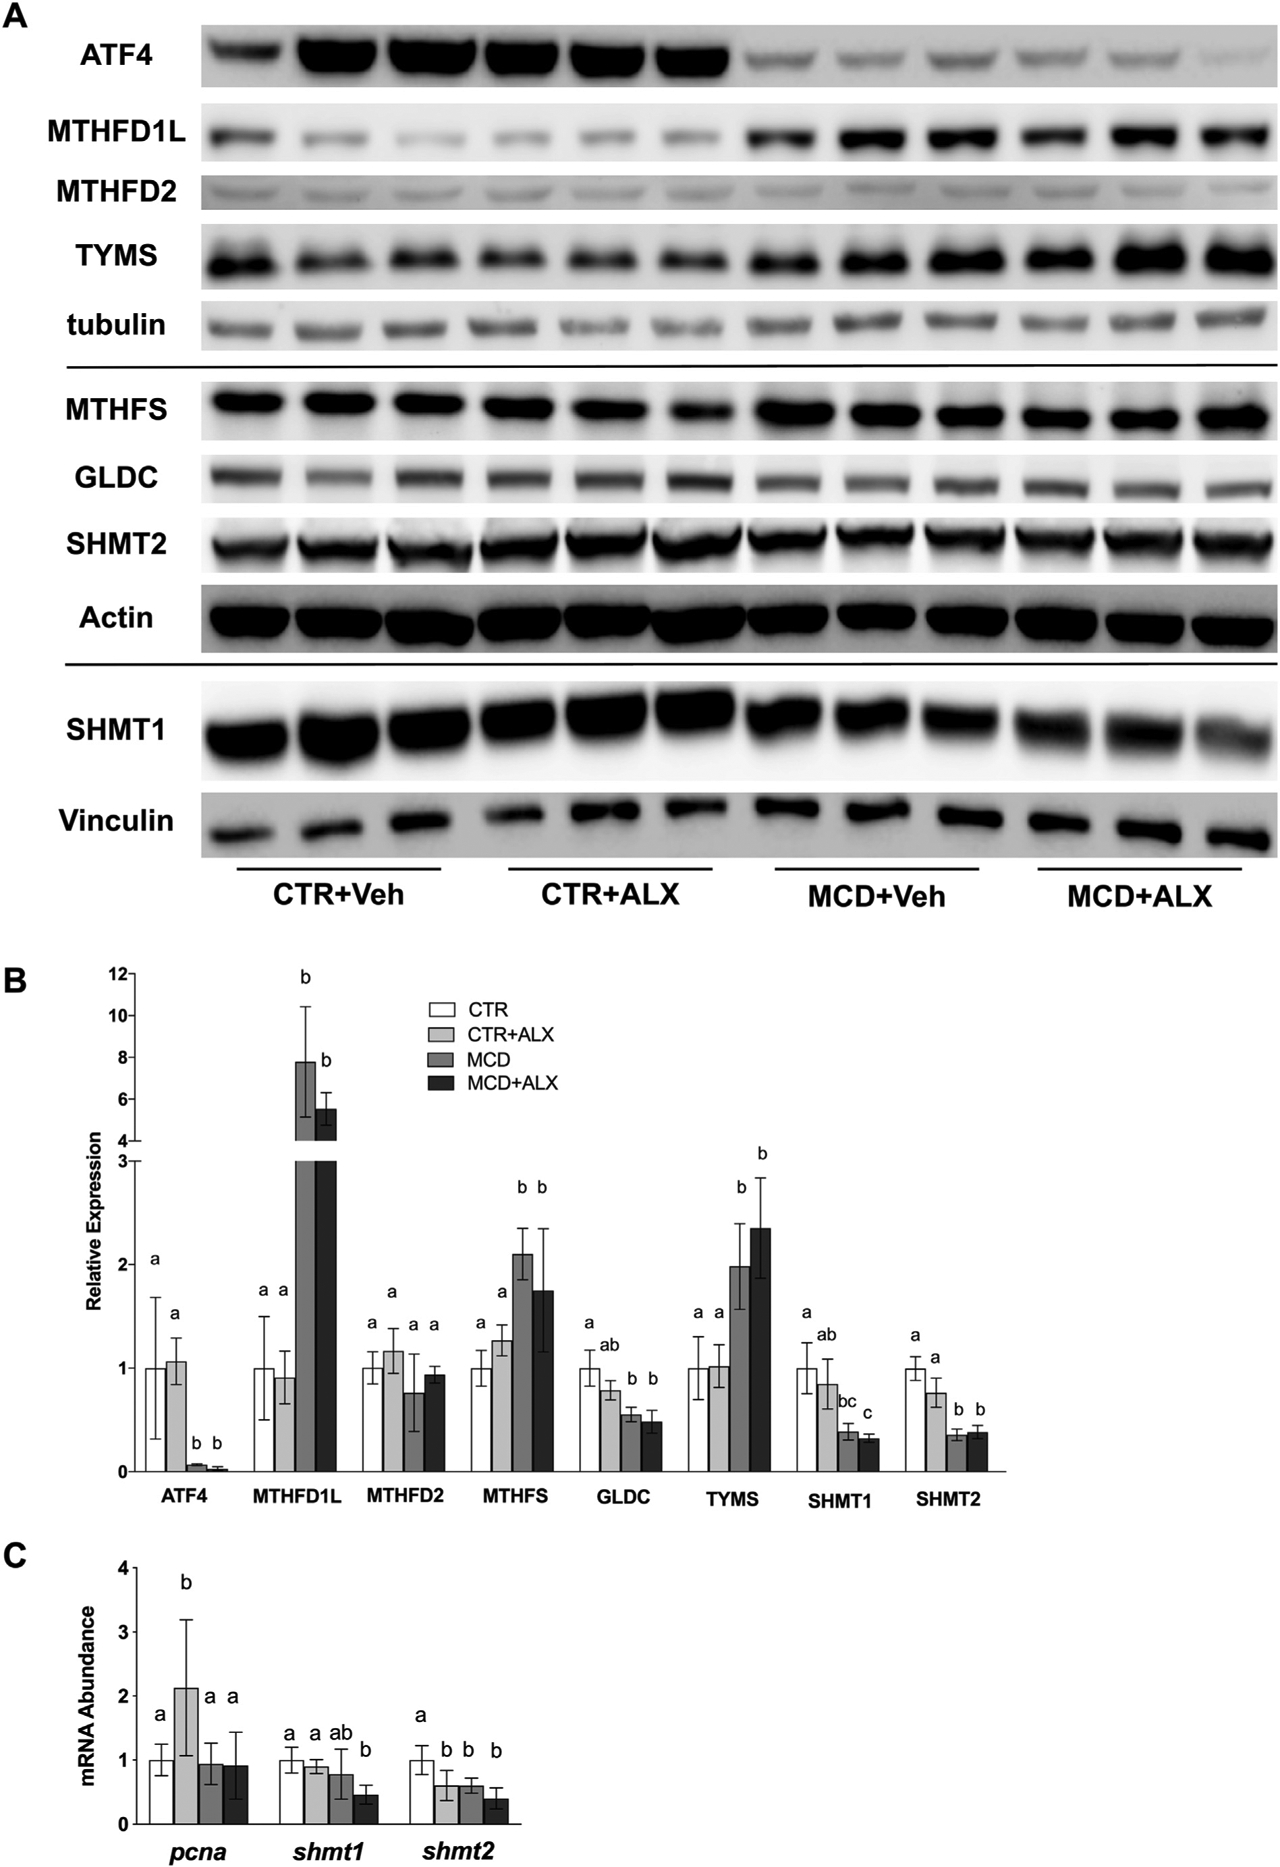
MCD diet and alloxazine treatment both disrupt hepatic one-carbon metabolism.Western blots of ATF4, MTHFD1L, MTHFD2, TYMS, MTHFS, GLDC, SHMT1, and SHMT2 in mouse liver (A). Relative expression of proteins measured by western blotting (B). mRNA abundance of pcna, shmt1 and shmt2 was measured in mouse liver using RT-qPCR (C). White bars represent CTR+Veh, white bars with pattern represent CTR+ALX, dark bars represent MCD+Veh, and dark bars with pattern represent MCD+ALX. Different lowercase letters denote a significant difference (P<.05, n=3). PCNA, proliferating cell nuclear antigen. All data are presented as mean ± standard deviation.