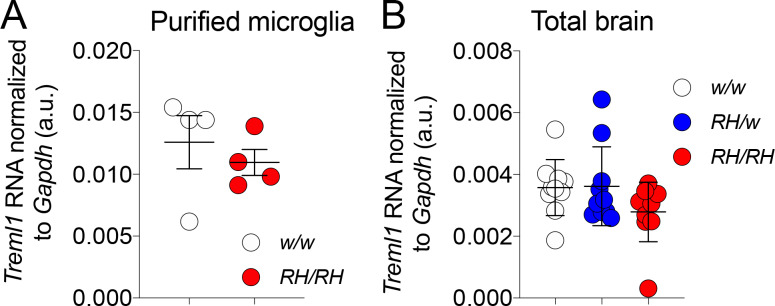
Figure 4. Treml1 mRNA expression is normal in Trem2R47H rats.
(A) Levels of Treml1 mRNA were measured and normalized to Gapdh mRNA expression. We used microglia purified from 2 male and 2 female 5/6 weeks old rats for each genotype (Trem2w/w and Trem2R47H/R47H). Data were analyzed by unpaired student’s t-test (p=0.5198), and presented as average (Treml1/Gapdh)± SEM. (B) Treml1 mRNA expression was measured in total brains. We used 5 female and 5 male (6–8 weeks of age) for each genotype (Trem2w/w, Trem2R47H/w and Trem2R47H/R47H). Data are represented as (Treml1/Gapdh) mean ± SEM and were analyzed by ordinary one‐way ANOVA (F(2, 27)=1.940, p=0.1632).

