Figure 2. Developmental, but not adult, PDGFRα+ cells are adipogenic.
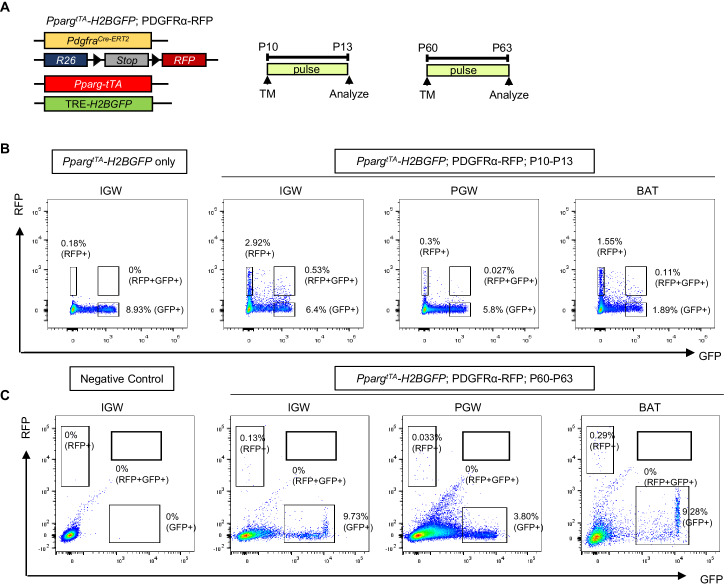
(A–B) PdgfraCre-ERT2; Rosa26RRFP (PDGFRα-RFP) male mice were administered TM at P10 (A) or P60 (B). Stromal vascular fraction of cells (SVF) were isolated from IGW of the mice after 3 days and cultured. The numbers indicate the percentage of the RFP+ labeled adipocytes. Scale = 100 μm. (C) TM-induced PDGFRα-RFP male mice either at P10 or P60 were fed chow or HFD until P120. SVF were isolated from IGW of the mice at P120, cultured, and examined for direct RFP fluorescence. Scale = 100 μm. (D) The real-time q-PCR analysis of adipogenic markers from cells described in C. *p<0.05 P10 RFP- compared to P10 RFP+ cells. (E) Gene expression levels of P10 and P60 RFP+ cells in SVF isolated from pooled IGW (n = 10). *p<0.05 P60 RFP+ compared to P10 RFP+ cells. Data are expressed as mean ± SEM. (F) PpargtTA-H2BGFP; PDGFRα-RFP male mice were administered TM at P10 or P60. SVF were isolated from the pooled IGW, PGW, and BAT depots (n = 8) after 3 days and sorted using RFP signal. GFP+RFP+ cells were quantified.


