. 2020 Jun 25;9:e56844. doi: 10.7554/eLife.56844

Figure 3. Sequential appearance of the vacuolar cargo in Golgi and PVE compartments.

(A) Appearance of the vacuolar cargo in early Golgi compartments marked with GFP-Vrg4 and in late Golgi compartments marked with Sec7-HaloTag. Cells were grown to mid-log phase, labeled with JF646, and imaged by 4D confocal microscopy. Prior to beginning the video, fluorescence from leaked cargo molecules in the vacuole was bleached by illuminating with maximum intensity 561 nm laser power for 20–30 s. SLF was added directly to the dish between the first and second Z-stacks, and then additional Z-stacks were captured every 30 s for 29.5 min. Images are representative time points from Figure 3—video 1. The top panel shows the merged images, and the other panels show the individual fluorescence channels for cargo, Vrg4, and Sec7. Scale bar, 2 µm. (B) Appearance of the vacuolar cargo in PVE compartments marked with Vps8-GFP and in the vacuole marked with Vph1-HaloTag. The procedure was as in (A), except that Z-stacks were captured every 60 s for 60 min. Images are representative time points from Figure 3—video 2. The top panel shows the merged images, and the other panels show the individual fluorescence channels for cargo, Vps8, and Vph1. Scale bar 2 µm. (C) Quantification of the percentage of compartments containing detectable cargo from (A) and (B). Confocal movies were average projected and manually scored for the presence of cargo in labeled compartments. For each strain, at least 26 cells were analyzed from four movies. The bars represent SEM. (D) Quantification of the percentage of the total cargo fluorescence present in early Golgi, late Golgi, and PVE compartments 10 min after SLF addition. The fluorescence for a compartment marker was used to generate a mask to quantify the corresponding cargo fluorescence. Data were taken from at least 26 cells from four movies. The bars represent SEM.

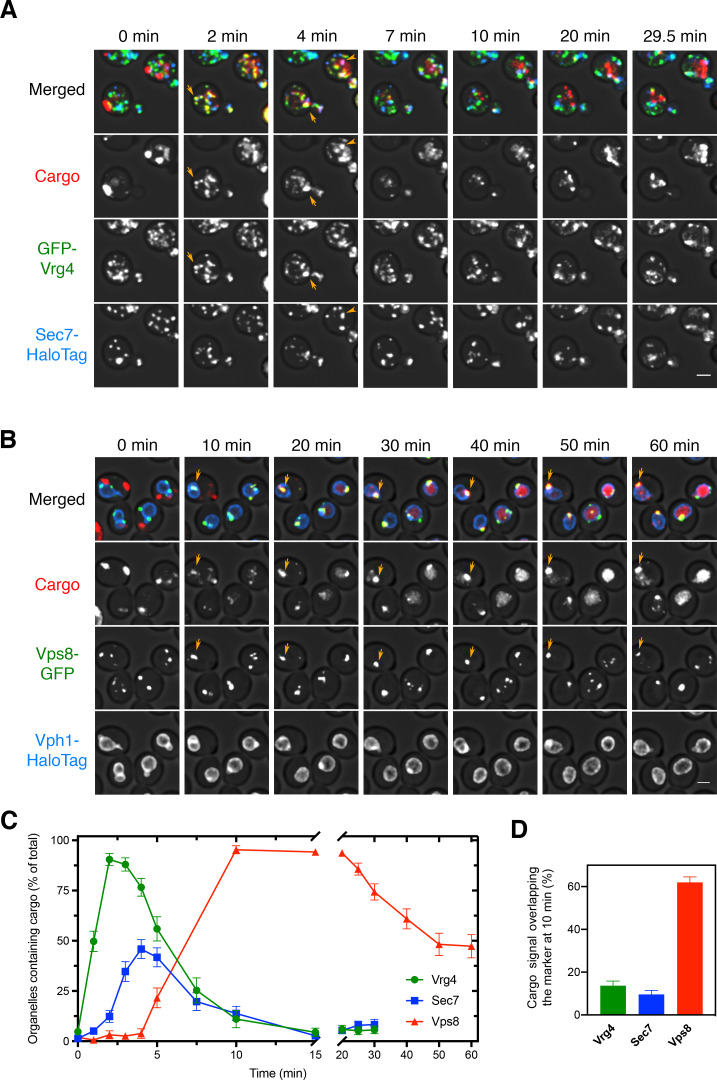
Figure 3.

Figure 3—video 1. Visualizing traffic of the vacuolar cargo together with Golgi markers.
Download video file (369KB, mp4)
Cells expressing the cargo together with the early Golgi marker GFP-Vrg4 and the late Golgi marker Sec7-HaloTag were grown to mid-log phase, labeled with JF646, and imaged by 4D confocal microscopy. Prior to imaging, fluorescence from leaked cargo molecules in the vacuole was bleached by illuminating with maximum intensity 561 nm laser power for 20–30 s. SLF was added directly to the dish between the first and second Z-stacks, and then additional Z-stacks were captured every 30 s for 29.5 min. In these average projected Z-stacks, fluorescence data are superimposed on brightfield images of the cells. The top panel shows the merged images, and the other panels show the individual fluorescence channels for cargo, Vrg4, and Sec7. Frames from this video are shown in Figure 3A. Scale bar, 2 µm.
Figure 3—video 2. Visualizing traffic of the vacuolar cargo together with PVE and vacuole markers.
Download video file (341.8KB, mp4)
Cells expressing the cargo together with the PVE marker Vps8-GFP and the vacuolar membrane marker Vph1-HaloTag were grown to mid-log phase, labeled with JF646, and imaged by 4D confocal microscopy. Prior to imaging, fluorescence from leaked cargo molecules in the vacuole was bleached by illuminating with maximum intensity 561 nm laser power for 20–30 s. SLF was added directly to the dish between the first and second Z-stacks, and then additional Z-stacks were captured every 1 min for 60 min. In these average projected Z-stacks, fluorescence data are superimposed on brightfield images of the cells. The top panel shows the merged images, and the other panels show the individual fluorescence channels for cargo, Vps8, and Vph1. Frames from this video are shown in Figure 3B. Scale bar, 2 µm.