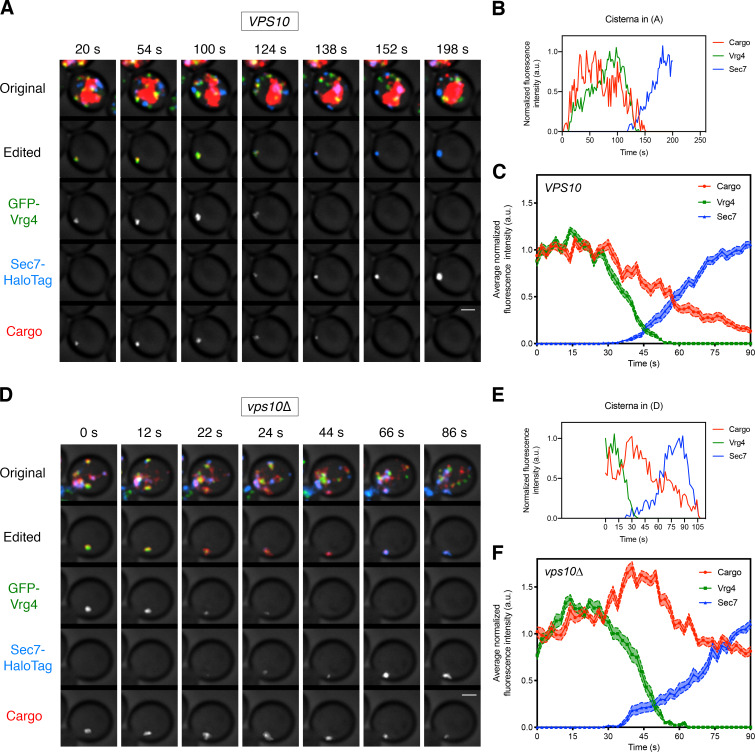
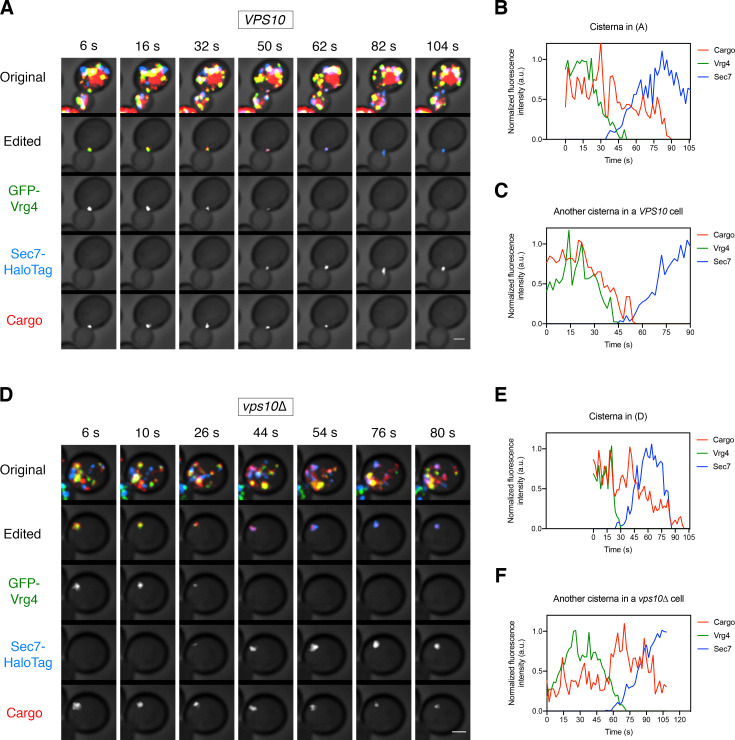
Figure 4. Visualizing the vacuolar cargo during Golgi maturation.
(A) Visualizing the vacuolar cargo in a VPS10 wild-type strain. Cells expressing the vacuolar cargo together with the early Golgi marker GFP-Vrg4 and the late Golgi marker Sec7-HaloTag were grown to mid-log phase, labeled with JF646, and imaged by 4D confocal microscopy. SLF was added 1–3 min before imaging. Shown are average projected Z-stacks at representative time points from Figure 4—video 1. The top row shows the complete projection, the second row shows an edited projection that includes only the cisterna being tracked, and the other rows show the individual fluorescence channels from the edited projection. The large red structure is the vacuole, which contained cargo molecules that had escaped from the ER prior to SLF addition as described in Figure 1. Scale bar, 2 µm. (B) Quantification of the fluorescence intensities of the Golgi markers and the vacuolar cargo during a typical maturation event. Depicted are the normalized fluorescence intensities in arbitrary units (a.u.) of the cisterna tracked in (A). (C) Average cargo signal during the early-to-late Golgi transition. For 21 maturation events from 18 movies of cells expressing moderate levels of the vacuolar cargo, fluorescence was quantified over a 90 s window with Z-stacks collected every 2 s. Normalization was performed by defining the maximum value as the average of the first six fluorescence values for the cargo and Vrg4, or of the last six fluorescence values for Sec7. Traces were aligned at the midpoint of the Vrg4-to-Sec7 transition, and the normalized fluorescence signals were averaged. The shaded borders represent SEM. (D) Visualizing the vacuolar cargo in a vps10∆ strain. The experiment was performed as in (A). Shown are average projected Z-stacks at representative time points from Figure 4—video 2. (E) Quantification of the fluorescence intensities of the Golgi markers and the vacuolar cargo during a typical maturation event in the vps10∆ strain. Depicted are the normalized fluorescence intensities in arbitrary units (a.u.) of the cisterna tracked in (D). (F) Average cargo signal during the early-to-late Golgi transition in a vps10∆ strain. The experiment was performed as in (C). Data were collected for 12 maturation events from 12 movies of cells expressing moderate levels of the vacuolar cargo.


