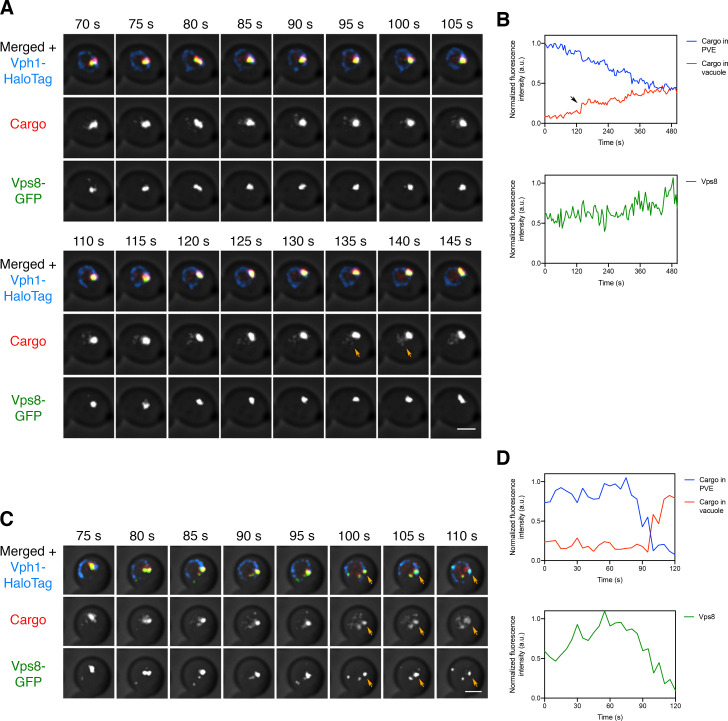
Figure 7. Visualizing transfer of the vacuolar cargo from PVE compartments to the vacuole.
(A) Gradual movement of the vacuolar cargo from a PVE compartment to the vacuole. A strain expressing the vacuolar membrane marker Vph1-HaloTag, the PVE marker Vps8-GFP, and the vacuolar cargo was grown to mid-log phase, attached to a confocal dish, and treated with SLF for 10–15 min to enable the cargo to reach PVE compartments. Prior to imaging, a region that excluded PVE compartments was photobleached by illumination with maximum intensity 561 nm laser light for 40 s. Shown are frames from Figure 7—video 1. The top row shows the complete projection, the middle row shows the cargo fluorescence, and the bottom row shows the Vps8-GFP fluorescence. Orange arrows indicate sudden transfer of a small amount of cargo from the PVE compartment to the vacuole. Scale bar, 2 µm. (B) Quantification from (A) of the time course of cargo fluorescence in the PVE compartment and the vacuole, and of the Vps8 signal. To quantify the cargo signal at each time point, the Vph1 or Vps8 signal was selected in a 3D volume and then the cargo fluorescence within that volume was measured. Normalized data are plotted in arbitrary units (a.u.). The black arrow points to the same cargo transfer event that is marked by the orange arrows in (A). (C) Example of sudden transfer of a large amount of cargo from a PVE compartment to the vacuole. The experiment was performed as in (A). Shown are frames from Figure 7—video 2. Orange arrows indicate an event in which nearly all of the cargo moved from the PVE compartment to the vacuole. (D) Quantification of (C), performed as in (B).

