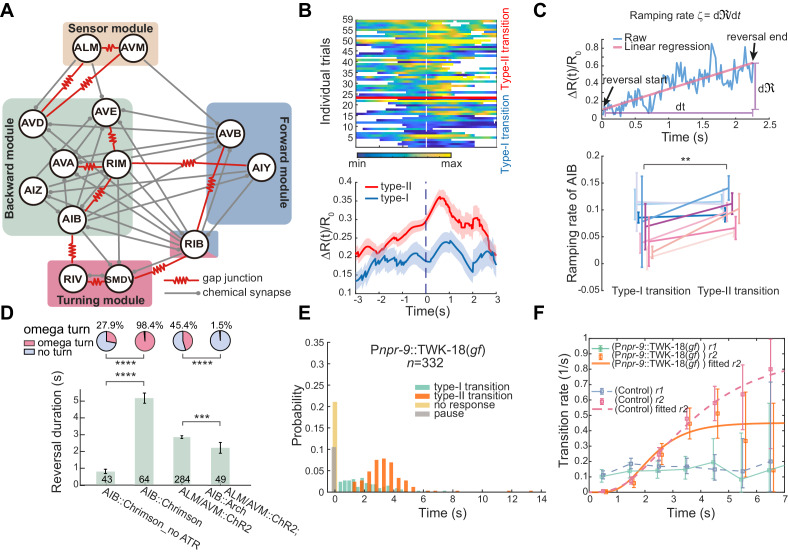
Figure 2. Interneurons AIB are crucial for motor state transitions.
(A) Simplified circuit diagram underlying the gentle touch induced escape responses. Neurons were grouped into four modules based on their functional roles and activity patterns. (B) Calcium activity of AIB during spontaneous reversals before type-I (n = 23) and type-II (n = 36) transitions in unrestrained behaving animals (Pinx-1::GCaMP6;Pinx-1::wCherry). Here, data are aligned to the ends of reversals (vertical dashed line, t = 0). Heat map across trials (up) and ΔR(t)/R0 (Mean ± SEM, bottom) are shown. (C) Ramping rate of calcium activity in AIB. Up, raw single trial ΔR(t)/R0 from reversal start to reversal end. The ramping rate is the slope of the red line, fitted by linear regression. Bottom, ramping rates of AIB during type-I and type-II transitions. Each color (Mean ± SEM) represents single animal data across multiple trials. Total nine animals (Pinx-1::GCaMP6;Pinx-1::wCherry) were tested. Very short reversals (less than 1.5 s) are excluded, for some of them have negative ramping rates and the slope estimate is susceptible to noise (but including those trials doesn’t affect our conclusion). **p<0.01, two-way ANOVA. (D) Optogenetic activation of AIB (635 nm, 4.46 mW/mm2, 7 s) or inhibition of AIB (561 nm, 21.71 mW/mm2, 12 s) during ALM/AVM (473 nm, 14.71 mW/mm2, 1.5 s) triggered avoidance behaviors, reversal durations (bar graph) and fractions of animals executing omega turns (pie chart) are shown. Error bars are SEMs. Bar graph, Mann–Whitney U test. Pie chart, χ2 test. *p<0.05, ***p<0.001, ****p<0.0001. Here and below, the actual turning percentages (nturn/ntotal) are noted beside the pie chart and numbers within the bars indicate the number of trials with reversal. (E–F) Reversal length distribution (E) and transition rates (F) during escape responses when AIB were persistently hyperpolarized through an exogenous expression of the potassium channel TWK-18. Control group is from Figure 1C.


