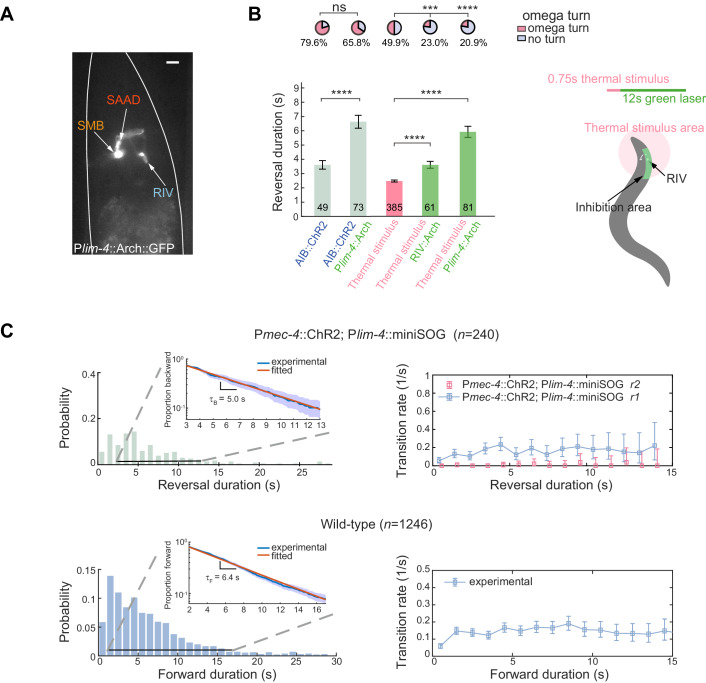
Figure 6. Feedback inhibition from the turning module contributes to reversal termination.
(A) Expression pattern of Plim-4::Arch::GFP. Scale bar, 10 µm. (B) Left, escape responses induced by optogenetic activation of AIB (blue text, 473 nm, 14.71 mW/mm2, 1.5 s) or thermal stimulus (pink text, 1480 nm, 0.75 s) followed by optogenetic inhibition of Arch-expressed interneurons (green text, 561 nm, 21.71 mW/mm2, 12 s). Bar graph, reversal durations, Mann–Whitney U test and error bars are SEMs. Pie chart, fractions of trials executing omega turns, χ2 test. *p<0.05, ***p<0.001, ****p<0.0001. All multiple comparisons were adjusted using Bonferroni correction. Right, schematic diagram for selective inhibition of RIV near animal head during thermally induced (1480 nm, 0.75 s) escape responses. (C) Up, reversal length distribution (left) and transition rate (right) in RIV/SAAD/SMB ablated animals. Bottom, spontaneous run length distribution (left) and transition rate from forward to backward movements (right) in wild-type animals. Insets are plots of survival functions: proportion of trials moving backward (up) or forward (bottom) until t. We fitted only trials with reversal duration ≥3 s and forward duration ≥2 s.

