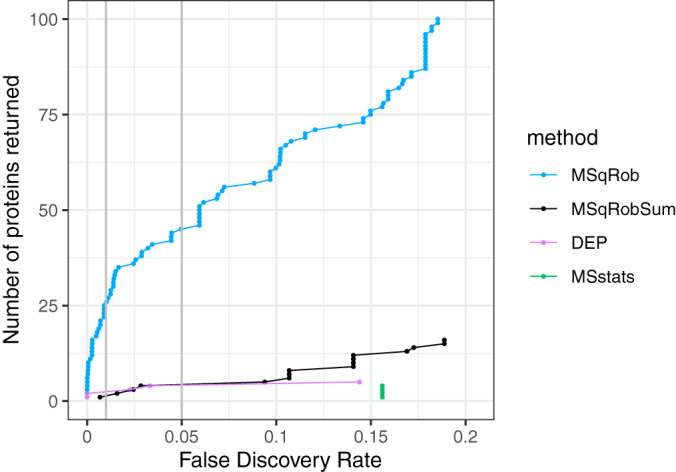
Fig. 4.

Comparison of different tools for DE analysis of proteins on the Latosinka dataset. We compare MSqRob, MSqRobSum, Differential Enrichment analysis of Proteomics data (DEP), and MSstats. The plot shows the number of proteins that are returned by each method at a certain FDR level. The two vertical gray lines indicate the 1 and 5% FDR level. MSqRob is the methods that the largest number of proteins as DE. The DEP analysis returns more proteins than MSqRobSum at 1% FDR, and an equal number of proteins at 5% FDR; but MSqRobSum always returns proteins at higher FDR levels. MSstats has the lowest sensitivity.
