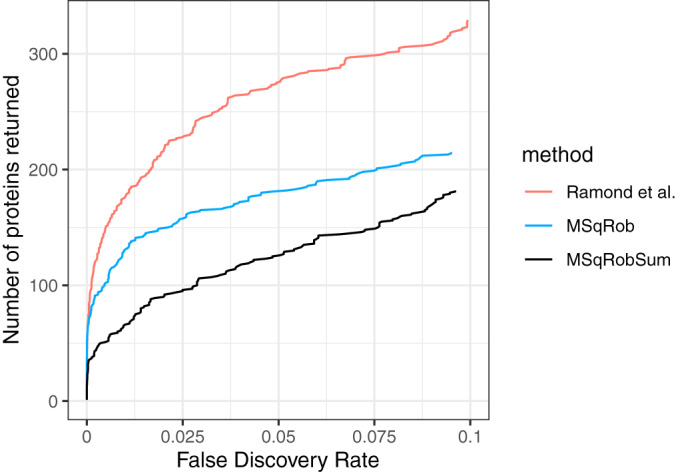
Fig. 5.

Comparison of MSqRob and MSqRobSum for DE analysis of proteins on the Francisella dataset. We compare the results of the original analysis by Ramond et al. (2015), MSqRob and MSqRobSum. Ramond et al. return the largest number of proteins as DE and MSqRobSum returns the lowest number of DE proteins.
