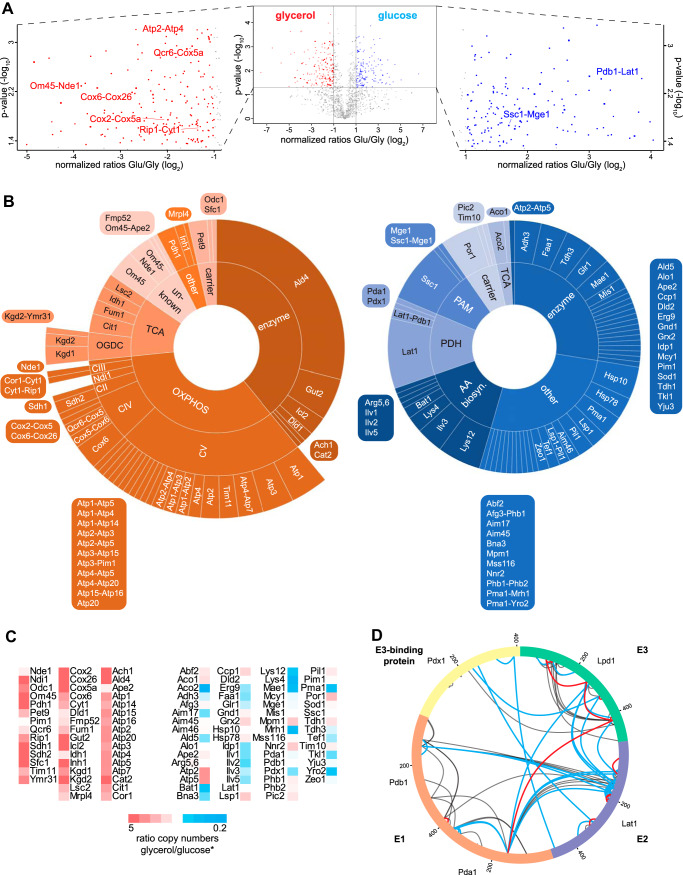
Fig. 3.
Quantitative cross-linking analysis of mitochondria isolated from yeast grown on glycerol- or glucose-containing medium. A, Volcano plot representing quantified cross-linked residue peptide pairs. Negative log10-transformed p value is plotted against normalized log2-transformed heavy (glucose, blue) to light (glycerol, red) ratios. Residue pairs with a p value ≤ 0.05 and a fold change ≥ 2 were considered as significantly changed. Left and right boxes, zoomed area for glycerol and glucose condition, respectively, with exemplary labeled interprotein cross-links of different quantities. B, Protein interactions clustered according to their category described in Fig. 1, depicted as sunburst diagrams. Cross-links with higher intensity under glycerol condition are shown in the left diagram (red) and under glucose condition in the right one (blue). Area of the fields is proportional to the number of unique residue pairs. C, Ratios of copy numbers of each quantified protein in both of the conditions. Red, higher copy number in glycerol; blue, higher copy number in glucose. *, values taken from Morgenstern et al. (55). D, Intraprotein- and interprotein cross-links within the pyruvate dehydrogenase complex (PDH) identified in the qualitative data sets. Blue lines, cross-links only identified under glucose condition; red lines, cross-links only identified under glycerol condition; black lines, common links. Visualized by xVis (80).

