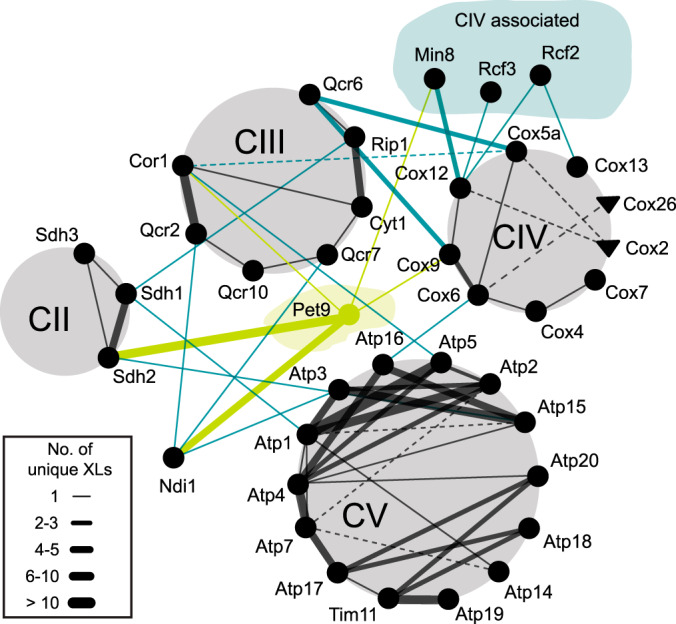
Fig. 4.

Interaction network within the OXPHOS system identified in the glycerol data set. Ndi1, CIV associated proteins and Pet9 are included. Only interprotein cross-links are displayed. Solid and dashed lines indicate interactions identified in the qualitative and the quantitative data set, respectively. Circles and triangles indicate proteins identified in the qualitative and quantitative data set, respectively. Thickness of the edges is proportional to the number of unique residue pairs. Black lines, intra-complex cross-links; turquoise lines, inter(-complex) cross-links.
