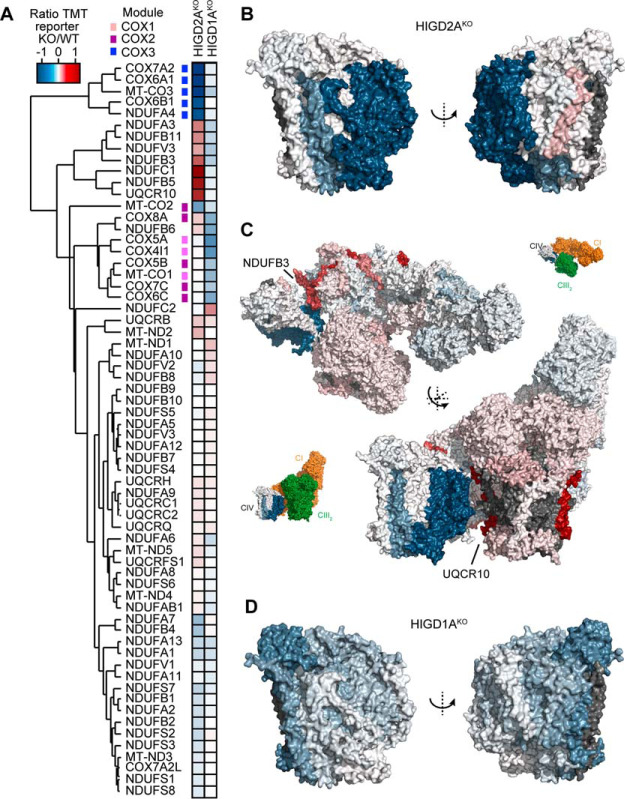
Fig. 4.
Loss of HIGD2A affects the COX3 module of complex IV. A, Two-dimensional heatmap showing hierarchically clustered protein ratios for subunits of complex I, III and IV. Modules of complex IV are indicated with the colored squares. B, Topographical heatmap showing protein ratios for subunits of complex IV in HIGD2AKO cells (PDB 5Z62) C, Topographical heatmap showing protein ratios for subunits of the human supercomplex in HIGD2AKO cells (PDB 5XTH). The insets show the orientation of the complex with complexes I and III colored in orange and green respectively. D, Topographical heatmap showing protein ratios for subunits of complex IV in HIGD1AKO cells (PDB 5Z62).

