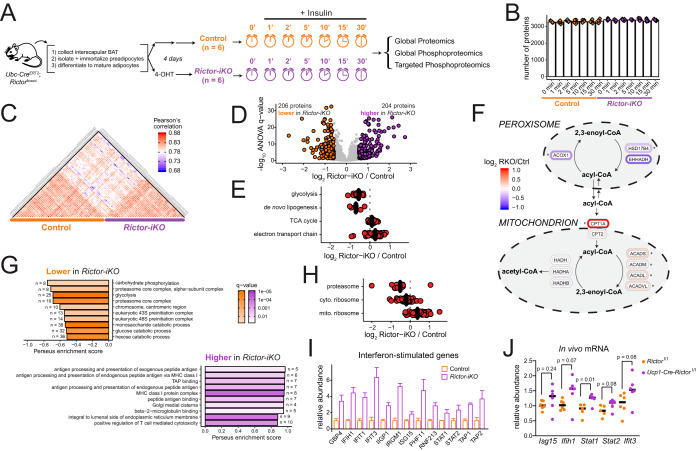
Fig. 1.
Rictor knockout reprograms metabolism and up-regulates an interferon-like response in brown adipocytes. A, A description of the inducible knockout system (left) and a schematic overview of proteome and phosphoproteome analysis over an insulin time series of brown adipocytes. B, The number of quantified proteins in each sample, organized by experimental condition. Bar height represents the median of all replicates for that condition. C, Heatmap showing Pearson's r correlation of protein abundance measurements between samples. D, Volcano plot showing the Rictor-iKO to control log2 fold-change averaged across all time points (x axis) and the -log10 ANOVA q-value (y axis) for proteins. Proteins significantly decreased in Rictor-iKO cells are shown in orange, and those significantly increased in Rictor-iKO cells are shown in purple. E, Protein abundance fold-change between Rictor-iKO and control (the mean of all time points) are shown for enzymes in the indicated metabolic pathways. F, Rictor-iKO versus control fold-change protein abundance data (the mean of all time points) mapped to a pathway model of fatty acid oxidation in the mitochondria and peroxisome. Asterisk (*) next to proteins indicates ANOVA q < 0.005. G, Top ten GO enrichment results of proteins that are higher in the control (top) or higher in the Rictor-iKO (bottom). H, Protein abundance fold-change between Rictor-iKO and control (mean of all time points) are shown for proteins in the proteasome, and the cytosolic and mitochondrial ribosomes. I, Bar plots for protein abundance of selected proteins previously reported as “interferon-stimulated genes.” Bar height is the mean fold-change across all time points, normalized to the control, and the error bars are standard deviation. J, RT-PCR analysis of selected interferon-stimulated genes from interscapular brown fat from Rictorl/l (control) and Ucp1-Cre;Rictorl/l mice.

