Fig. 2.
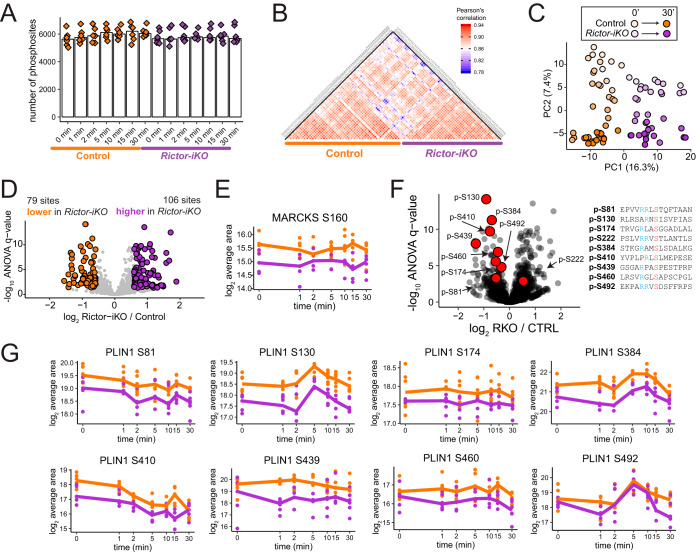
Basal phosphorylation levels in brown adipocytes are significantly altered by Rictor knockout. A, The number of quantified phosphorylation sites in all samples, organized by experimental condition. B, Heatmap showing Pearson's r correlation of phosphorylation site abundance measurements between samples. C, Principal component analysis showing the effect of both Rictor-iKO and insulin on brown adipocyte phosphorylation levels. D, Volcano plot showing the Rictor-iKO to control log2 fold-change averaged across all time points (x axis) and the -log10 ANOVA q-value (y axis) for protein-normalized phosphorylation sites. Sites significantly decreased in Rictor-iKO cells are shown in orange, and those significantly increased in Rictor-iKO cells are shown in purple. E, Protein-normalized quantification of MARCKS S160 phosphorylation. F, Identical volcano plot to 2D, except that sites on perilipin-1 are highlighted in red. The amino acid sequence windows for these sites are shown to the right with the phosphorylated residue in red and upstream arginine residues in blue. G, Protein-normalized quantification across the time series for phosphosites on perilipin-1.

