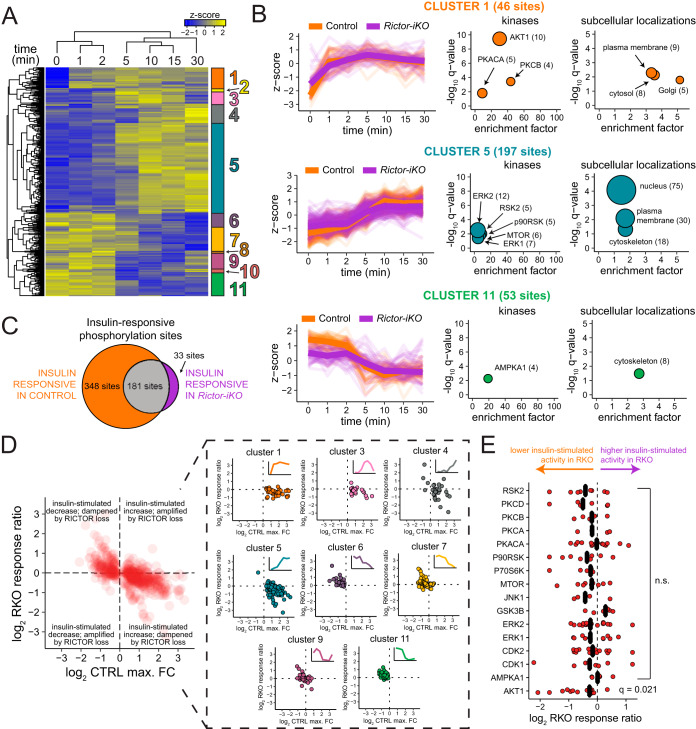
Fig. 3.
Rictor knockout dampens early and late insulin response. A, Hierarchical clustering of phosphorylation site abundances in the control reveals distinct patterns of increased and decreased phosphorylation over the insulin time series. Heat map shows the z-score of the mean phosphorylation site abundance for each condition. B, Z-scores (left) for each cluster defined in (A), with the median for each time point shown in bold. Each selected cluster was analyzed for enrichment of kinase substrates (middle) and subcellular localizations (right), where the fold-enrichment is plotted on the x axis, the y axis contains the -log10 q-value from a Fisher's exact test corrected by the Benjamini-Hochberg method, and the size of the circles corresponds to the number of sites represented by each term. C, Euler diagram showing the number of phosphorylation sites, in the control and Rictor-iKO, that fit a natural cubic spline function (q ≤ 0.05). D, Scatter plots assessing the RICTOR-dependence of the insulin response. The maximum insulin log2 fold-change in the control cells is shown on the x axis, and the log2 RKO response ratio is shown on the y axis. All insulin responsive sites are shown to the left in red; on the right they are organized by cluster. E, Analysis of kinase substrates from PhosphositePlus. The log2 RKO response ratio is shown on the x axis, q-values correspond to one-sample Student's t test followed by Benjamini-Hochberg correction.

