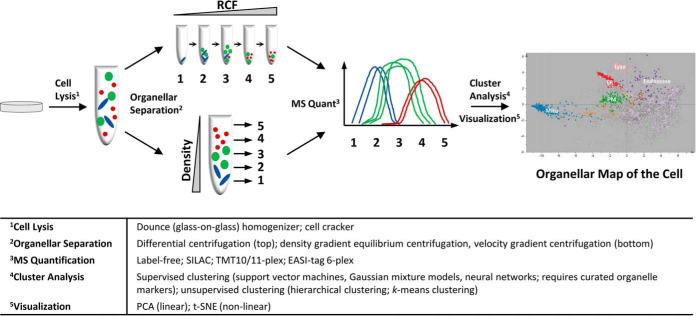
Fig. 1.
Generic workflow for generating organellar maps through proteomic profiling. Cells are lysed, and released organelles are partially separated by differential centrifugation (top) or density/velocity gradient centrifugation (bottom). Differential pellets or gradient fractions are analyzed by quantitative mass spectrometry. For each protein, an abundance distribution profile across the fractions is obtained. Organelles have overlapping but distinct profiles, and proteins predominantly associated with the same organelle have similar profiles. Dimensionality reduction tools (such as PCA) reveal groups of proteins with similar subcellular localization. By overlaying organellar marker proteins (color coded), the identity of clusters is revealed. Machine learning can be used to assign proteins to the nearest cluster. (Organellar map reproduced from (12)).

