Fig. 2.
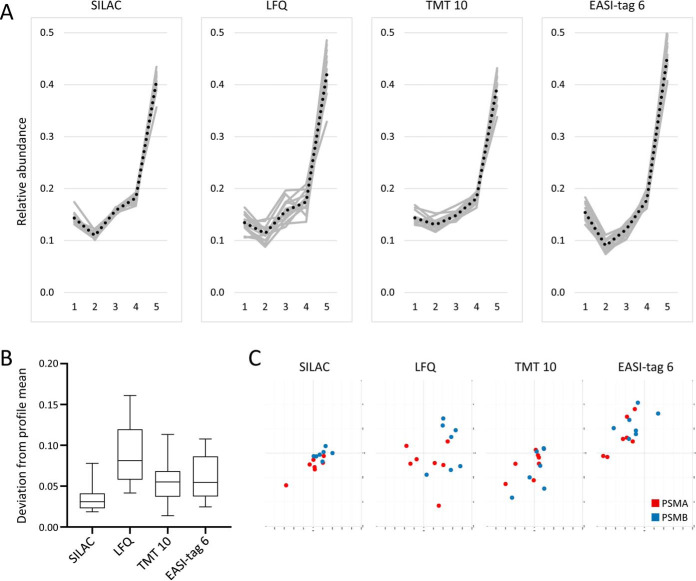
Organellar profiling of the core proteasome performed with different MS quantification strategies. HeLa cell lysates were fractionated into five pellets by differential centrifugation (Dynamic Organellar Maps approach (17)). The relative abundances of the 14 proteasomal core subunits (PSMA1 to PSMB7) were quantified across the fractions (normalized to sum 1). Because the core proteasome is a stable complex, the profiles are expected to be identical, and deviations largely reflect quantification error. Quantification was achieved by four different approaches (all based on data-dependent acquisition): label-free quantification using the MaxLFQ (43) algorithm; quantification against an invariant SILAC (44) heavy reference; labeling with TMT10-plex and MS3 quantification (SPS method; (47)); and labeling with EASI-tag 6-plex (46) and MS2 quantification. A, Relative abundance profiles; subunits in light gray, means in dashed black. SILAC quantification produces a tight profile cluster with finely nuanced resolution of small differences in the low abundance fractions (1–3). The LFQ profiles show substantially more scatter. TMT profiles are tighter than the LFQ profiles, but have a flatter shape in the first three fractions. The EASI-tag profile has the largest dynamic range. B, Profile scatter, i.e. distribution of (Manhattan) distances of the 14 profiles in A) to the average profile. Boxes show mean (line) and 1st to 3rd quartile, whiskers 5th-95th percentile; data points outside this range are not shown. SILAC quantification has the lowest scatter (smallest mean and tightest distribution), whereas LFQ has the highest scatter. TMT10 and EASI-tag 6 show similar intermediate levels. C, PCA plot of the 14 core proteasome subunit profiles shown in A). PCA was jointly applied to all 4 × 14 = 56 profiles, but each plot only shows the profiles obtained with the indicated quantification method; all plots have the same scale, center, and PC loadings. PSMA and PSMB subunits are color coded. SILAC quantification shows the tightest cluster, and largely resolves the A/B subcomplexes. TMT and EASI-tag show partial resolution and intermediate cluster tightness. SILAC, LFQ and TMT data were published previously (17); EASI-tag profiles were also generated in house (our unpublished data). All raw files were processed with MaxQuant (49). Importantly, the same sample set was used for LFQ, SILAC and EASI-tag quantification; for technical reasons, a very similar replicate of this set was used for TMT quantification. The LFQ profiles were obtained by reprocessing the SILAC raw files with detection of light peptides only (heavy reference channel ignored). The total MS analysis time was similar for all samples (32–40 h per map), as was the quality of instrumentation (LFQ/SILAC: Orbitrap HF; EASI-tag: Orbitrap HFX; TMT: Orbitrap Lumos).

