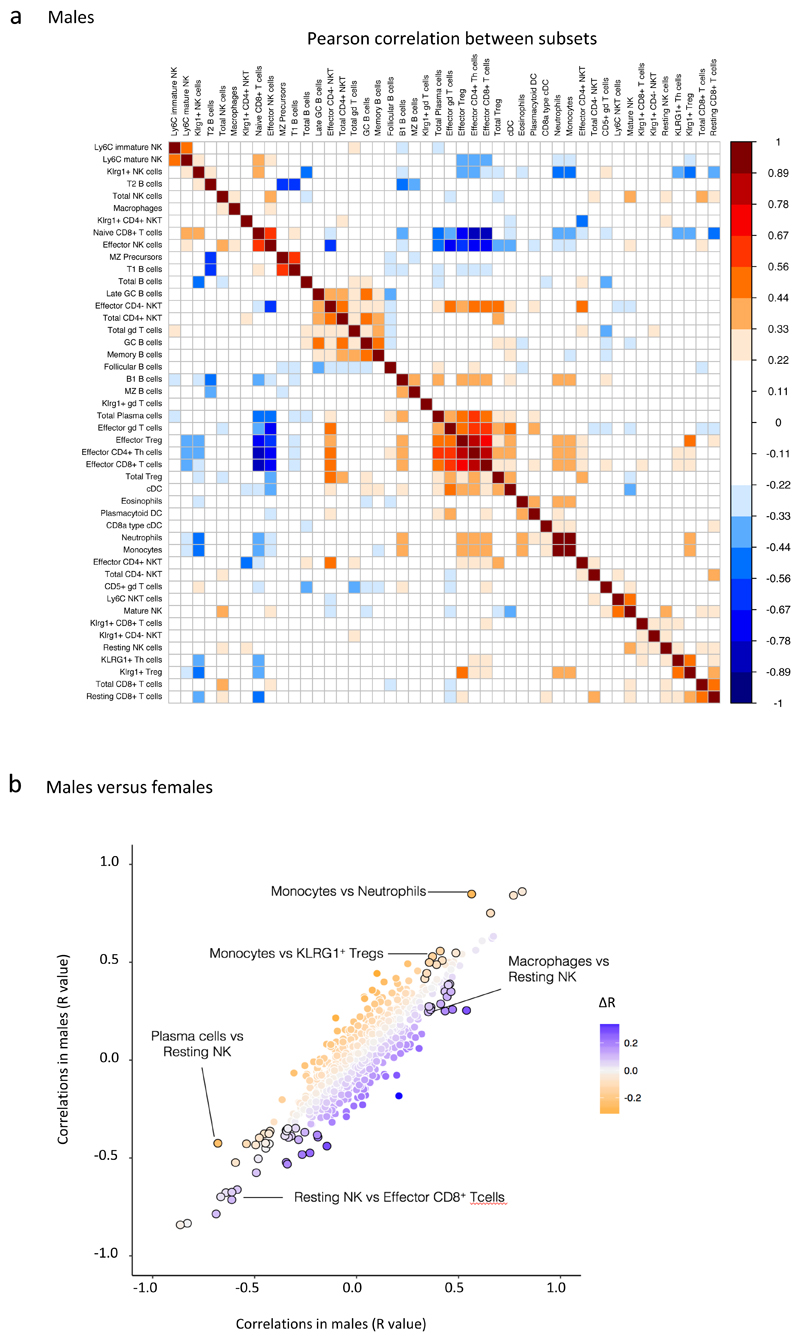
Figure 2. Correlations exist between immune parameters.
a. Heat map represents Pearson correlations of 46 splenic immune cell subsets with each other in wt males (n>230) as determined by flow cytometry. Dark red fields denote strong positive, dark blue fields strong negative correlations between frequencies of spleen immune cell subsets.
b. Correlation differences between males and females. Colour denotes ∆R, the difference between the correlation coefficient R for SPL subsets in male and female wt mice. Black circumferences mark parameter pairs that are significantly sexually dimorphic (see Materials and Methods). Correlation coefficients for male and female mice were derived from data depicted in Fig 2a and Fig S2, respectively.

