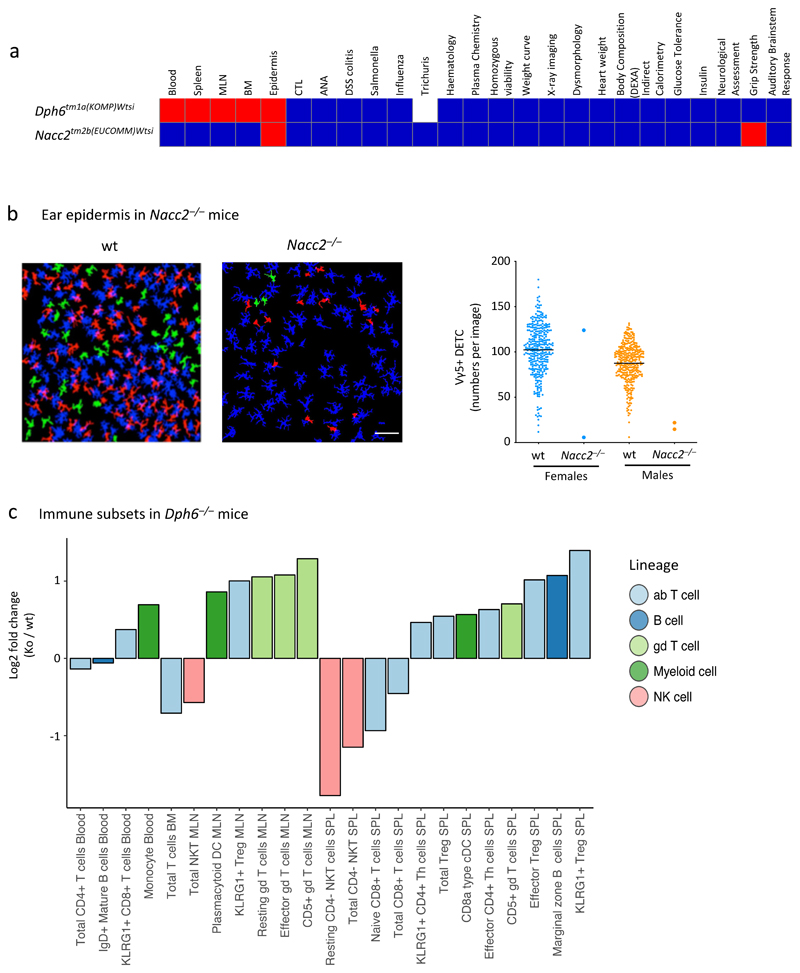
Figure 5. Examples of genes with specific impacts on the immune system.
a. Overview of two genes that display specific immunophenotypes. Colours as in Fig 4. Statistical methods and sample size differ between parameters – see Materials and Methods and www.immunophenotype.org for specific gene/parameter combination of n.
b. Vγ5 DETC in ear epidermis of wt and Nacc2–/–mice. The image represents a z-projection of cell outlines produced by image processing in Definiens Developer XD, which were used for quantitative object-based image analysis: blue, Langerhans cells (LC); red, Vγ5+ DETC contacting LC; green, Vγ5+ DETC not contacting LC. Bottom: cumulative data for Nacc2–/–mice (n=4) versus sex-matched wt controls (for females n=330, for males n=340, bar represents mean).
c. Phenotypic abnormalities in Dph6–/– mice. Fold change in immune cell subset proportions between Dph6–/– and wt mice across multiple tissues (Dph6–/–, n=6 for SPL, MLN, BM and n=14 for PBL; wt, n>500 for all parameters).

