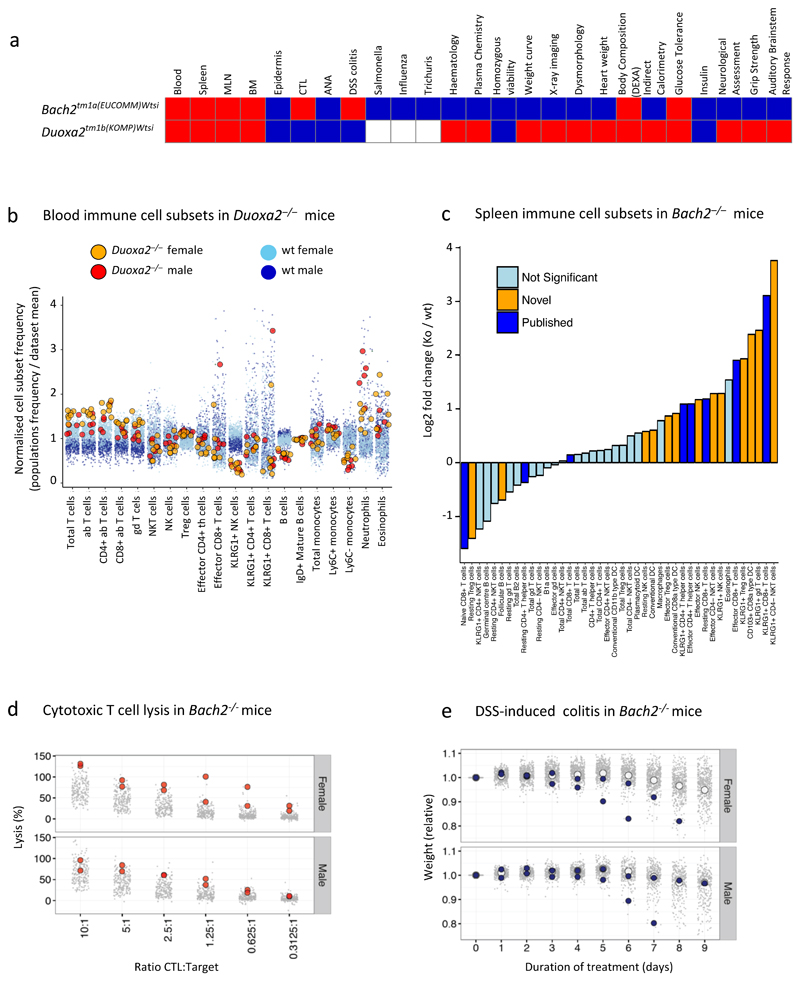
Figure 6. Examples of genes that impact upon the immune system and physiology.
a. Overview of two genes that exhibit broad immunophenotypes. Colours as in Fig 4. Statistical methods and sample size differ between parameters – see Materials and Methods and www.immunophenotype.org for specific gene/parameter combination of n.
b. Phenotypic abnormalities PBL in Duoxa2–/– mice. Relative PBL cell subset frequencies for Duoxa2–/– (n=11) versus wt mice (n>450 per sex for all parameters). Dark and light blue denote wt males and females; red and orange denote Duoxa2–/– males and females.
c. Effector cell subsets in Bach2–/– mice. Fold-change in SPL cell subset composition in mutant mice (n=6) versus wt controls (n=76). Yellow represents significant cellular phenotypes not previously reported, as detected by reference range; dark blue represents significant cellular phenotypes previously reported; light blue represents non-significant differences. KLRG1+CD4- NK cells: 10-fold increase, p=1.1x10⁻⁹; reference range combined with Fisher’s exact test).
d. Cytotoxic T lymphocytes in Bach2–/– mice (n=4) compared to wt controls (212 female and 208 male): grey points represent individual wt mice; red circles represent individual Bach2–/– mice.
e. DSS colitis in Bach2–/– mice (n=4) compared to wt controls (n=481 female and n=315male): grey points represent individual wt mice; white circles represent wt mean values; blue circles represent individual Bach2–/– mice.

