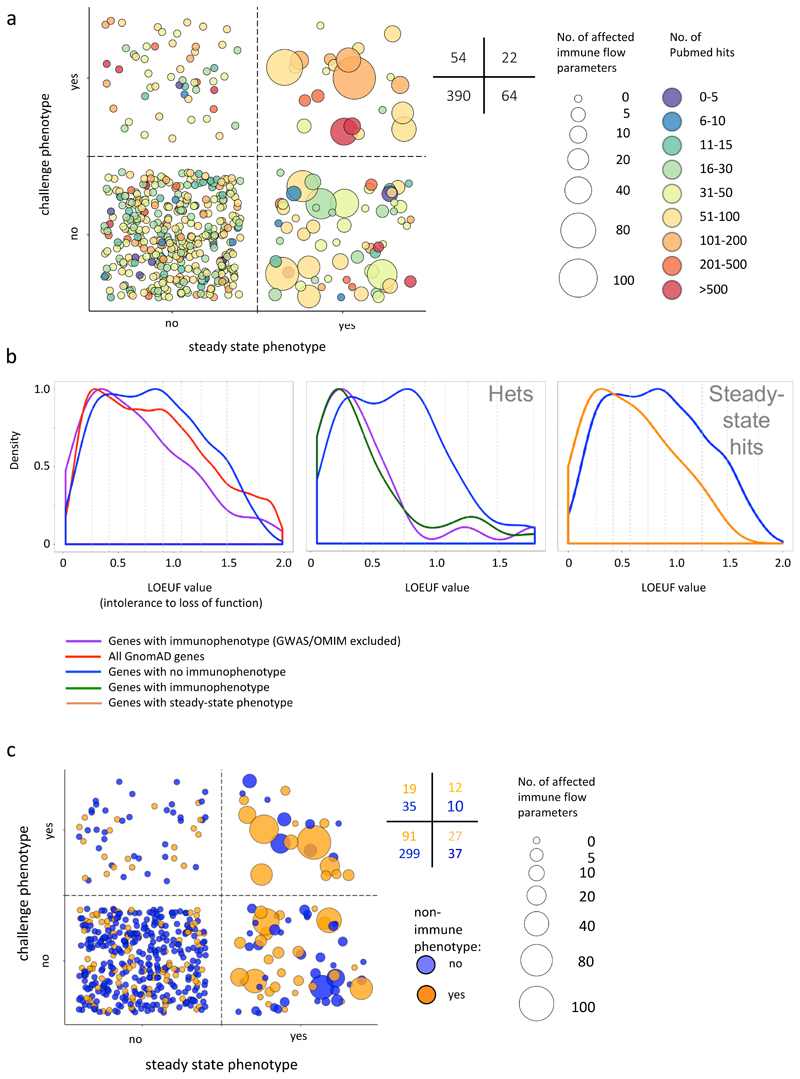
Figure 7. Genes affecting baseline immunophenotypes and challenge responses.
a. Effected parameters and Pubmed citations per gene. Each bubble represents one gene; size represents the number of immune flow phenotypes detected for that gene; colour represents the extent to which each gene has been reported on, determined by number of Pubmed citations, as of October 2018. Numbers denote the numbers of genes in quadrants of the figure.
b. Tolerance to LOF mutations in human orthologs of 3i genes. Left-hand panel: LOF tolerance scores derived from GnomAD for human orthologs of: 3i genes without hits (blue, n=334); 3i genes with hits OMIM/GWAS genes excluded (purple, n=77), and for all GnomAD genes (red, n=16037). A score of 0 denotes complete intolerance; a score of 2 complete tolerance to loss of function. Wilcoxon test: purple versus red p=0.010; purple versus blue p=0.009. Deciles of all genes marked with vertical grey broken lines. Middle panel: Genes tested in heterozygotes. 3i genes without hits (blue, n=109), 3i genes with hits (green, n=31), 3i genes with hits OMIM/GWAS genes excluded (purple, n=19). Wilcoxon test: purple versus blue p=0.0029; green versus blue p=0.003. Right-hand panel: Human orthologs of all 3i genes without hits (blue, n=334) versus genes with hits in steady state flow cytometry phenotypes but without challenge hits (orange, n=34); orange versus blue p=0.014, Wilcoxon test.
c. Relationship between immune phenotypes and non-immune phenotypes. Each bubble represents one gene; size represents the number of immune flow phenotypes detected for that gene; colour indicates non-immune phenotype. Genes with any immune hit and a non-immune phenotype (orange bubbles among bubbles in top and right bottom quadrants) versus not hit genes (orange bubbles among bubbles in left bottom quadrant); p=0.000072, Fisher exact test. Genes with baseline phenotype change and a non-immune phenotype (orange bubbles among bubbles in right bottom quadrant) versus not hit genes (orange bubbles among bubbles in left quadrants); p= p=0.00021, Fisher exact test.

