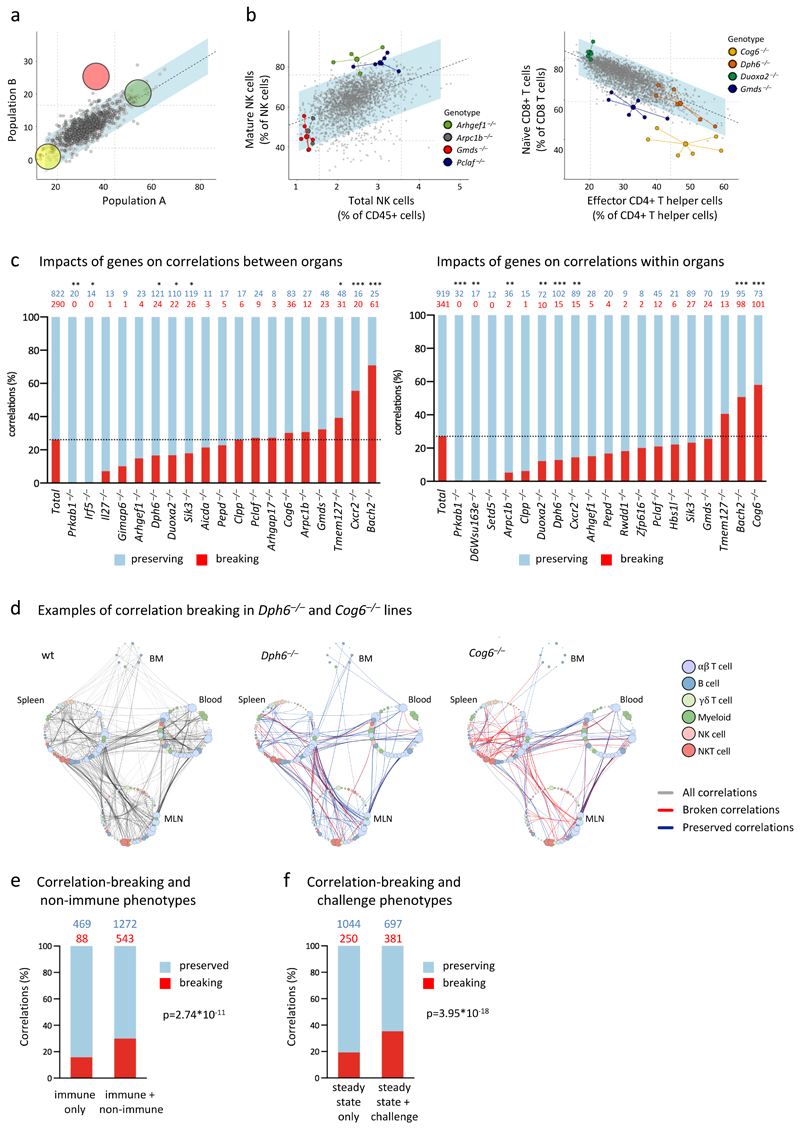
Figure 8. Phenodeviants preserve or break immunological structures.
a. Schematic illustrating the concept of structural perturbation. The yellow and green genes are theoretical hits in both correlated parameters (Pearson’s correlation), and exist as an exaggeration of the normal relationship that exists at steady state (grey dots represent wt mice). The pink gene is also a hit in both parameters, but breaks the correlation by falling outside the blue corridor that represents a 95% prediction confidence interval around the correlation line.
b. Examples of genes that preserve or disrupt immunological structure. Plotted are data frequencies of SPL subsets (indicated on x- and y-axes) as determined by flow cytometry. Data from mutant lines with phenotypes are highlighted in different colours; large dots represent the x/y centroid (mean) values, small dots represent data points for each mouse. Grey data points represent wt mice and mutant mice that are comparable to wt mice for both parameters shown. n=4 for Arhgef1–/–, n=5 for Arpc1b–/–, n=5 for Gmds–/–, n=4 for Pclaf–/–.
c. Genes differ in their capacity to break or preserve relationships. Stated in red font are the number of correlations that each cited gene disrupts and in blue font the residual number of correlations that each cited gene preserves, the total being all correlations contributed to by the steady-state parameters that the cited gene affects. These are represented as percentages in the left-hand graph (correlations across organs) and right-hand graph (correlations within the same organ). Only genes affecting parameters which contribute to >10 correlations are depicted. Statistical significance was determined by two-sided Fisher’s exact test in comparison to the data set average (dotted line). Number of correlations above bars, *p<0.05, **p<0.01, ***p<0.001.
d. Examples of genes that either preserve or disrupt many correlations. Plotted are parameters (colour-coded according to cell lineage) in BM, SPL, MLN, and PBL, and the correlations that link them in wt mice (left panel, grey lines) or in Dph6–/– mice (middle) or Cog6–/– mice (right), in which cases blue and red lines denote correlations that are preserved or broken, respectively.
e. Comparison of correlation breaking in genes that score in non-immune tests and immune tests versus genes that have hits only in immune parameters (Probit regression, p=2.74*10-11; p=7.45*10-7 when controlling for unequal numbers of correlations per gene; p=0.007 when allowing for any dependencies of correlations within a gene by using cluster-robust standard errors). Numbers of correlations above bars.
f. Comparison of correlation breaking in genes that score in challenge assays and steady-state immune tests versus genes that have hits only in steady-state immune parameters (Probit regression, p=3.95*10-18; p=9.10*10-16 when controlling for unequal numbers of correlations per gene; p=0.021 when allowing for any dependencies of correlations within a gene by using cluster-robust standard errors). Numbers of correlations above bars. Separate contributions of non-immune and challenge phenotypes: p= 1.56*10-6 for non-immune controlling for challenge; p=2.93*10-13 for challenge controlling for non-immune.

