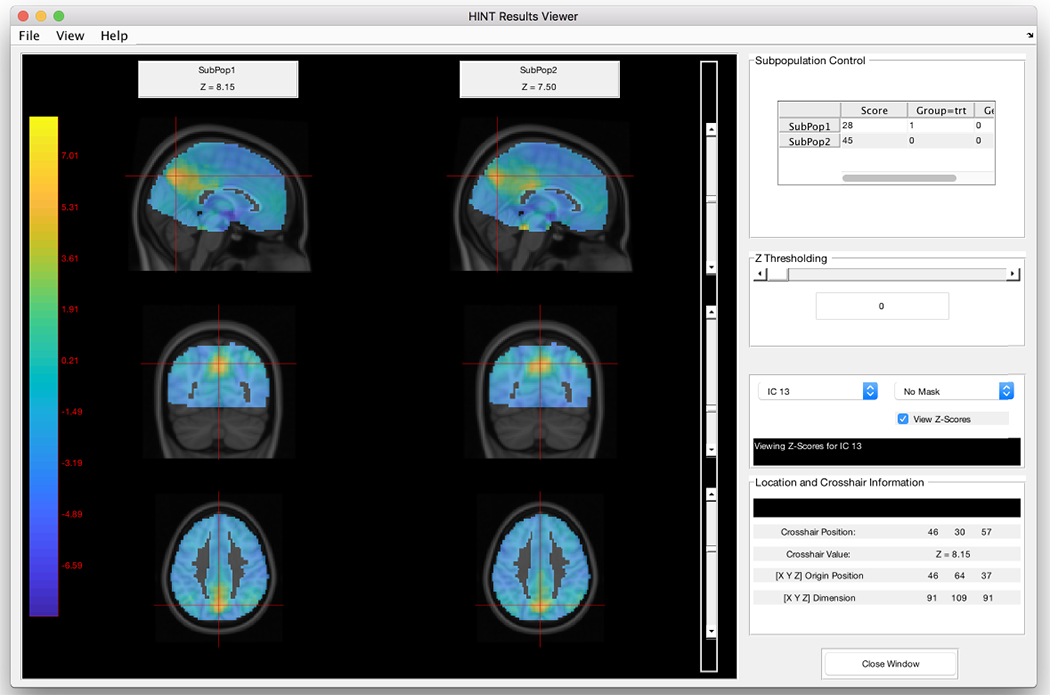
Figure 2:

Demonstration of the sub-population comparison window. Sub-populations based on user-defined covariate patterns can be generated and viewed using this display window. The sub-population control box in the upper-right hand corner allows the user to view the corresponding covariate values.
