Figure 9:

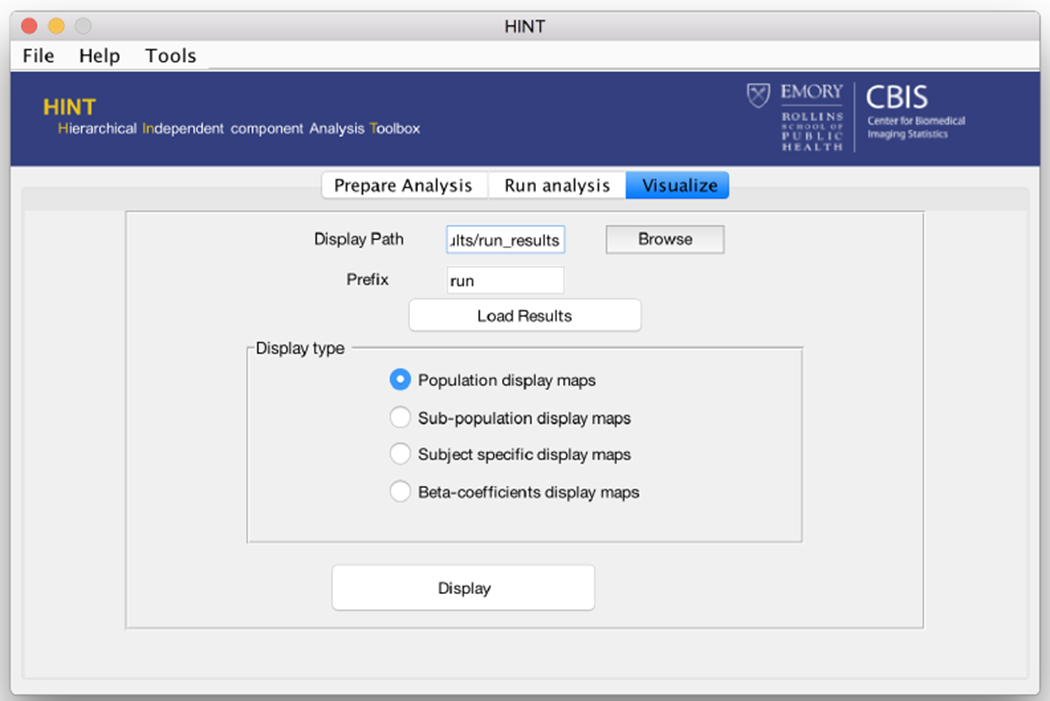
The HINT visualization panel. In this panel the user can view the overall study population-averaged maps, compare sub-populations, look at the estimated ICs for individual subjects, and examine the estimated beta coefficient maps.

The HINT visualization panel. In this panel the user can view the overall study population-averaged maps, compare sub-populations, look at the estimated ICs for individual subjects, and examine the estimated beta coefficient maps.