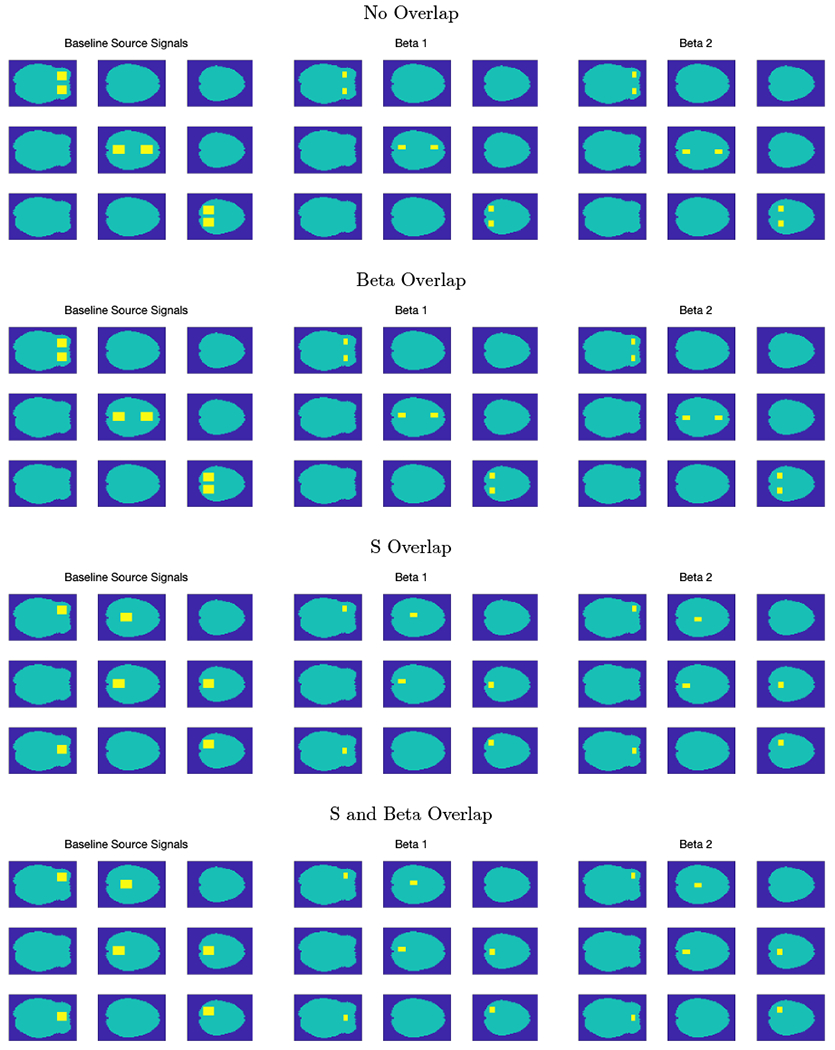
Table 4:
Spatial maps used for the synthetic data study. Within each image, each row corresponds to an IC. The first set of maps correspond to the baseline source signals. The middle set of maps corresponds to the covariate effect for the first covariate. The final set of maps corresponds to the covariate effect for the second covariate.
 |
